The ₹5 Lakh Question
At the end of the month, an auto components manufacturer reviews its quality report. The figure receiving the most attention is clear:
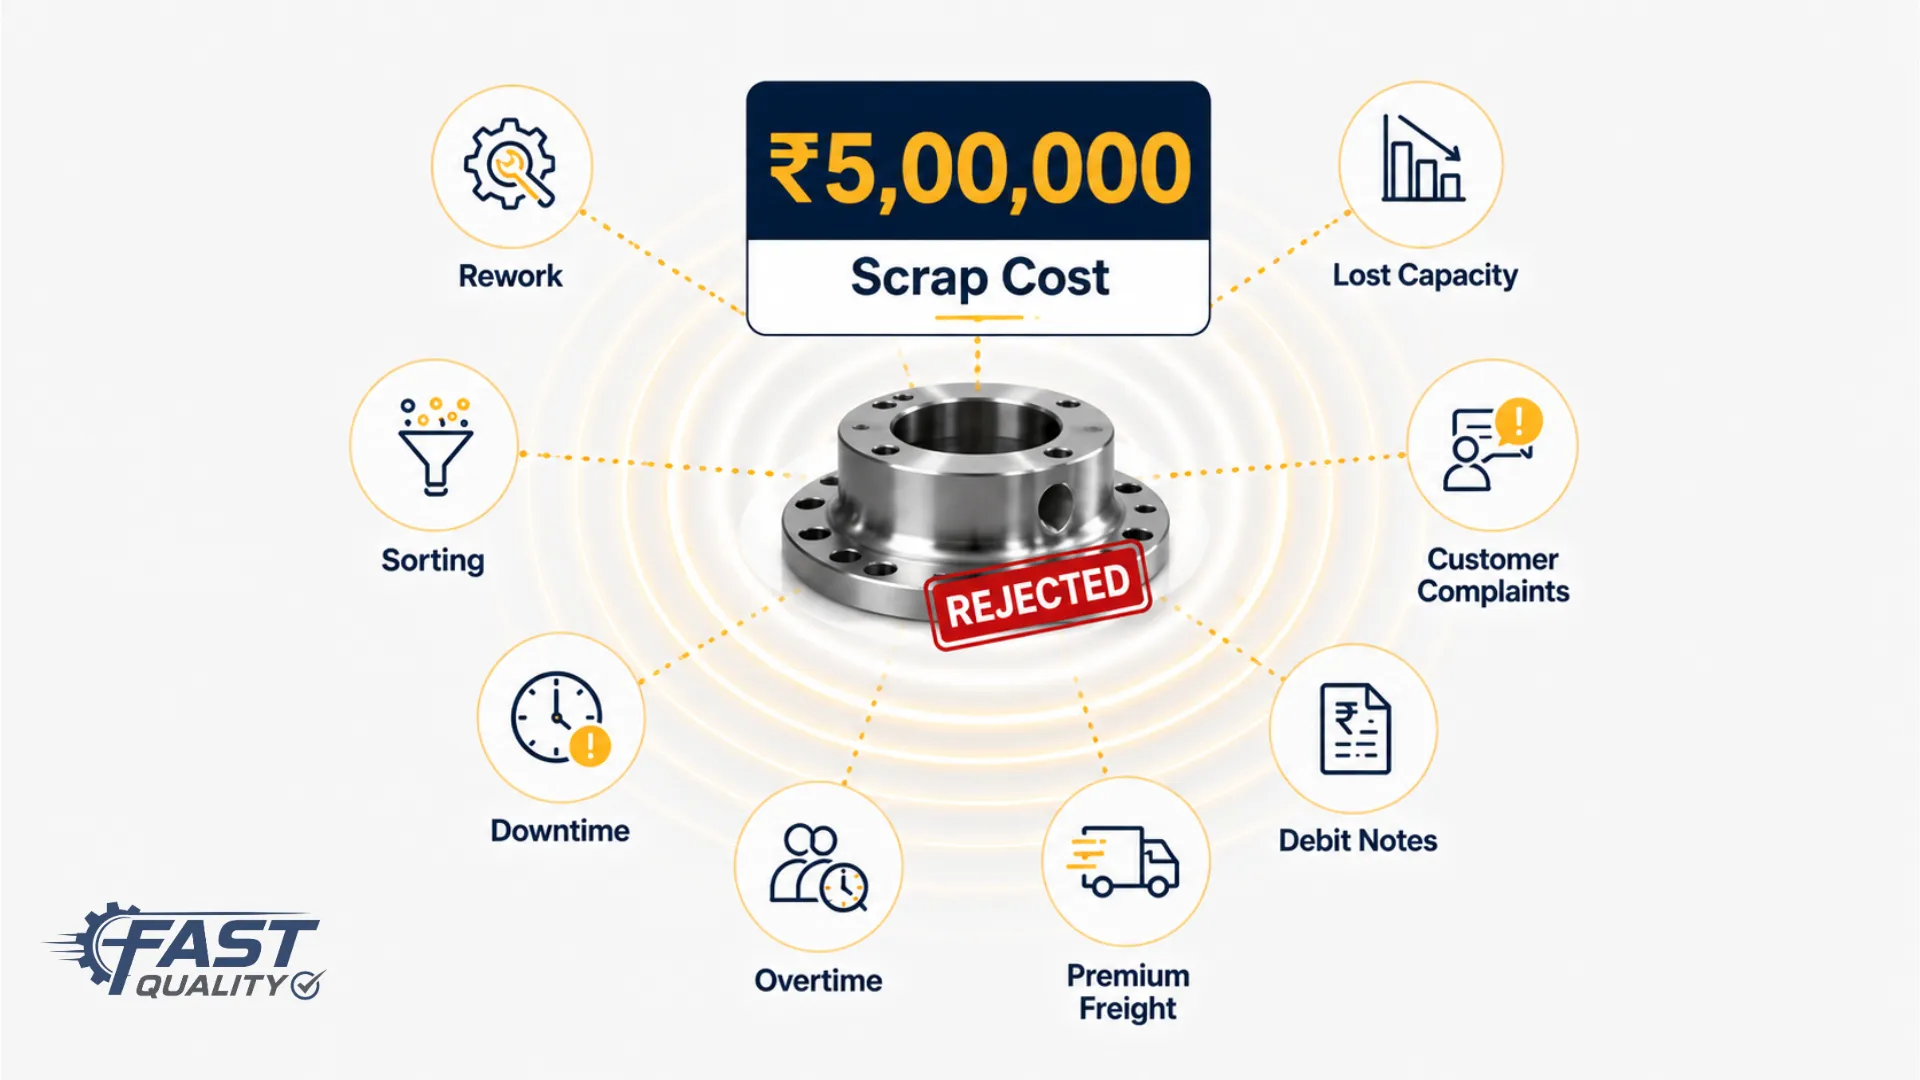
Scrap cost appears clearly in the monthly quality report — but it is only one part of the loss.
"Scrap cost: ₹5 lakh." — The number everyone sees. But what about the number no one measures?
It is easy to treat this as the total financial impact of poor quality. But scrap is only one part of the loss. The same rejected components may also have required additional inspection, sorting, rework labour, machine time, overtime, production rescheduling, and urgent replacement material.
If the issue affected dispatch, the manufacturer may also have paid for premium freight, customer debit notes, expedited production, or complaint handling. Some of these costs appear in the quality report. Others are recorded under production, maintenance, logistics, payroll, or customer service. Many are not connected back to the original defect at all.
So the real question is not: How much material did we scrap? It is: How much did poor quality actually cost the business?
That broader financial impact is known as the Cost of Poor Quality — COPQ — and in many manufacturing operations, it is significantly higher than the number visible in the monthly scrap report.
What Is the Cost of Poor Quality?
The Cost of Poor Quality, or COPQ, is the total financial loss created when a product, process, or service does not meet requirements the first time. It includes more than defective material — it also covers the additional work, time, capacity, and customer-related costs generated because something went wrong.
In manufacturing, COPQ usually appears in two main forms:
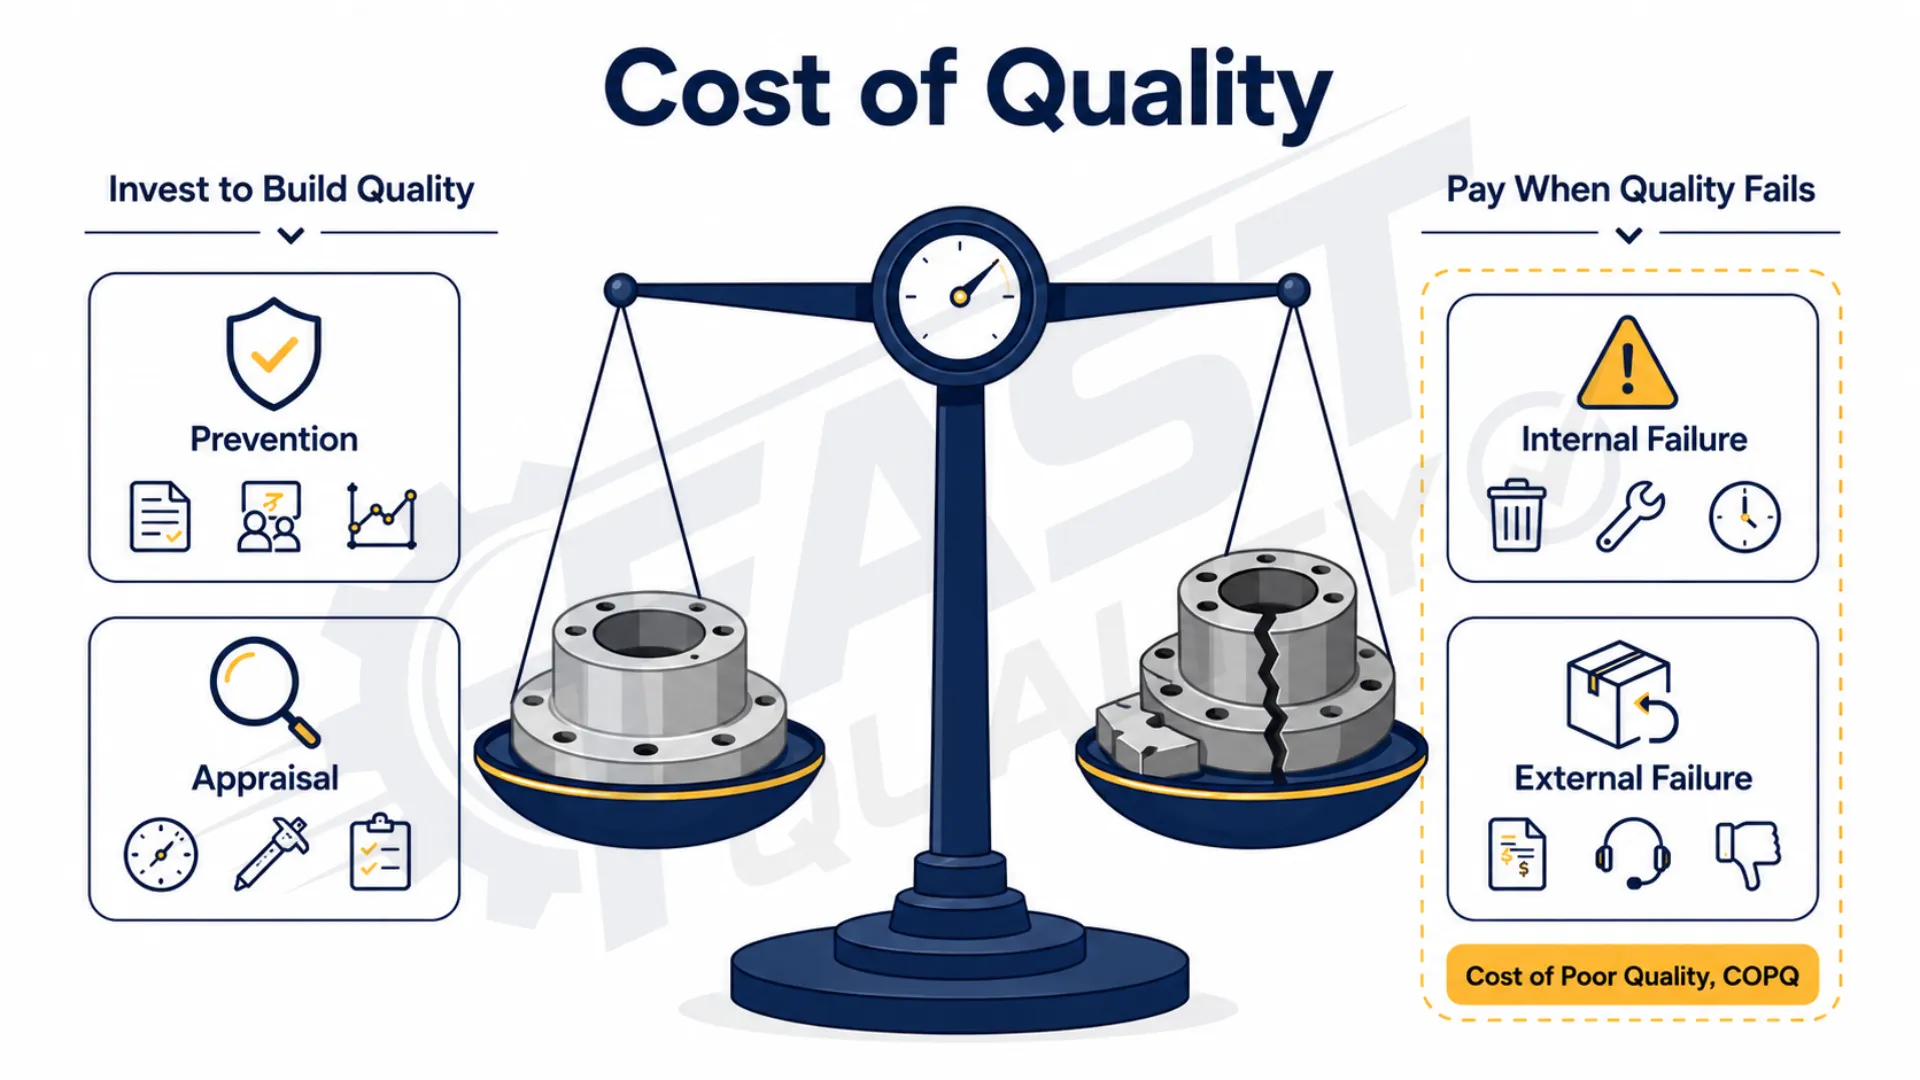
Cost of Quality (COQ) includes prevention and appraisal investments. COPQ covers only the failure losses.
Internal failure costs
These are losses identified before the product reaches the customer:
- Scrap and yield loss
- Rework and retesting
- Sorting and containment
- Production downtime
- Failure investigation
- Production delays
External failure costs
These occur after the product reaches the customer:
- Complaints and returns
- Warranty claims and replacements
- Customer debit notes and penalties
- Field failures and customer line stoppages
COPQ vs Cost of Quality — A Simple Distinction
Cost of Quality includes what a company spends to manage quality: training, inspection, calibration, process control, and supplier development. Cost of Poor Quality shows what the company loses when quality fails. One is an investment; the other is a loss.
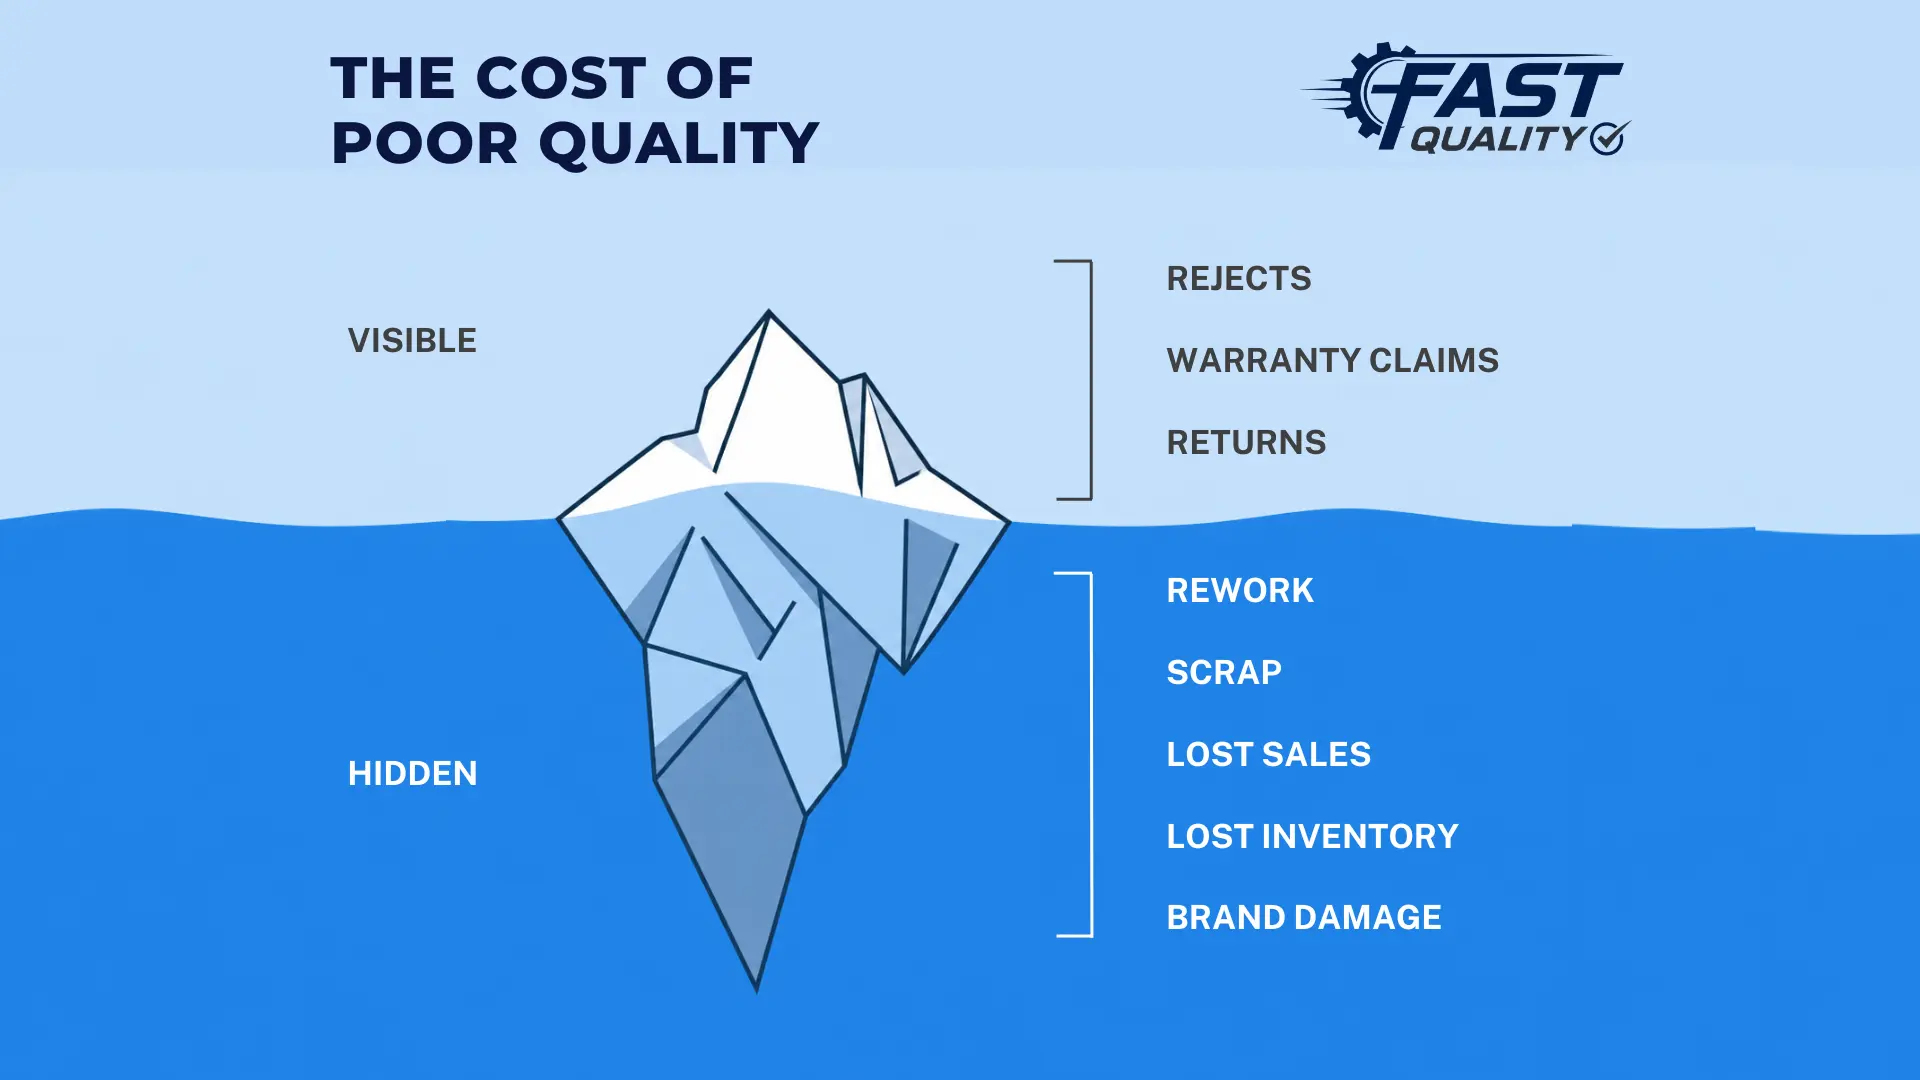
The COPQ Iceberg — What Your Reports Do Not Show
Most manufacturers can quickly identify scrap, rework, and customer returns. These costs are visible because they are usually recorded in quality or production reports. But the visible costs are often only the surface.
Below them sits a much larger group of expenses that may be recorded under different departments — or may not be measured at all.
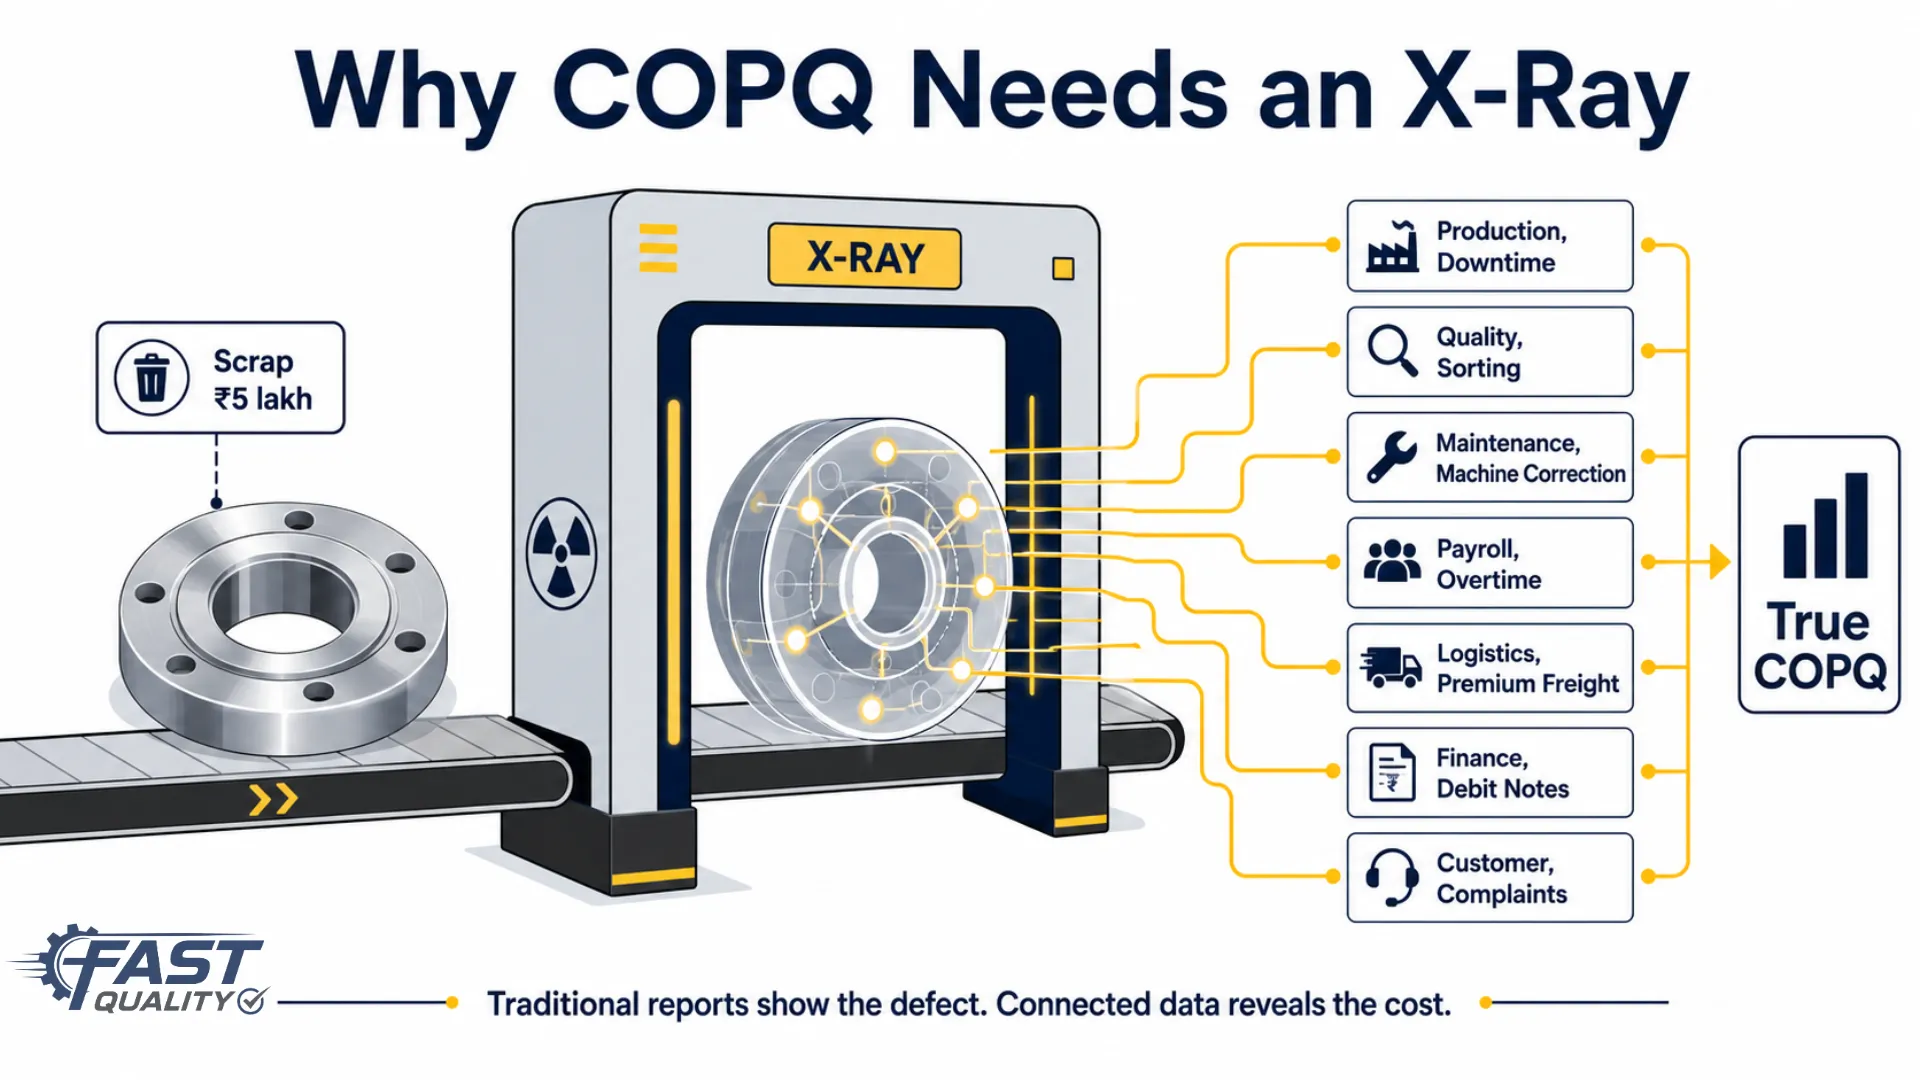
The most expensive quality cost may never appear under the word "quality" in the accounting system.
Visible costs
- Scrap, rework, retesting
- Reinspection and sorting
- Customer returns and warranty replacements
Hidden costs — often scattered across the business
- Machine and production line downtime
- Batch sorting and containment
- Overtime required to recover lost output
- Production rescheduling
- Additional supervision and engineering support
- Emergency material procurement
- Premium freight and delayed dispatches
- Customer debit notes and price reductions
- Capacity consumed by corrective work
- Lower customer or supplier ratings
- Loss of repeat orders
"The most expensive quality cost may never appear under the word 'quality' in the accounting system."
How One Defect Creates Costs Across the Business
A defect rarely creates only one cost. Consider a batch of machined auto components found with an out-of-tolerance bore diameter. The immediate quality record may show a rejection, but the financial impact begins much earlier and continues much further.
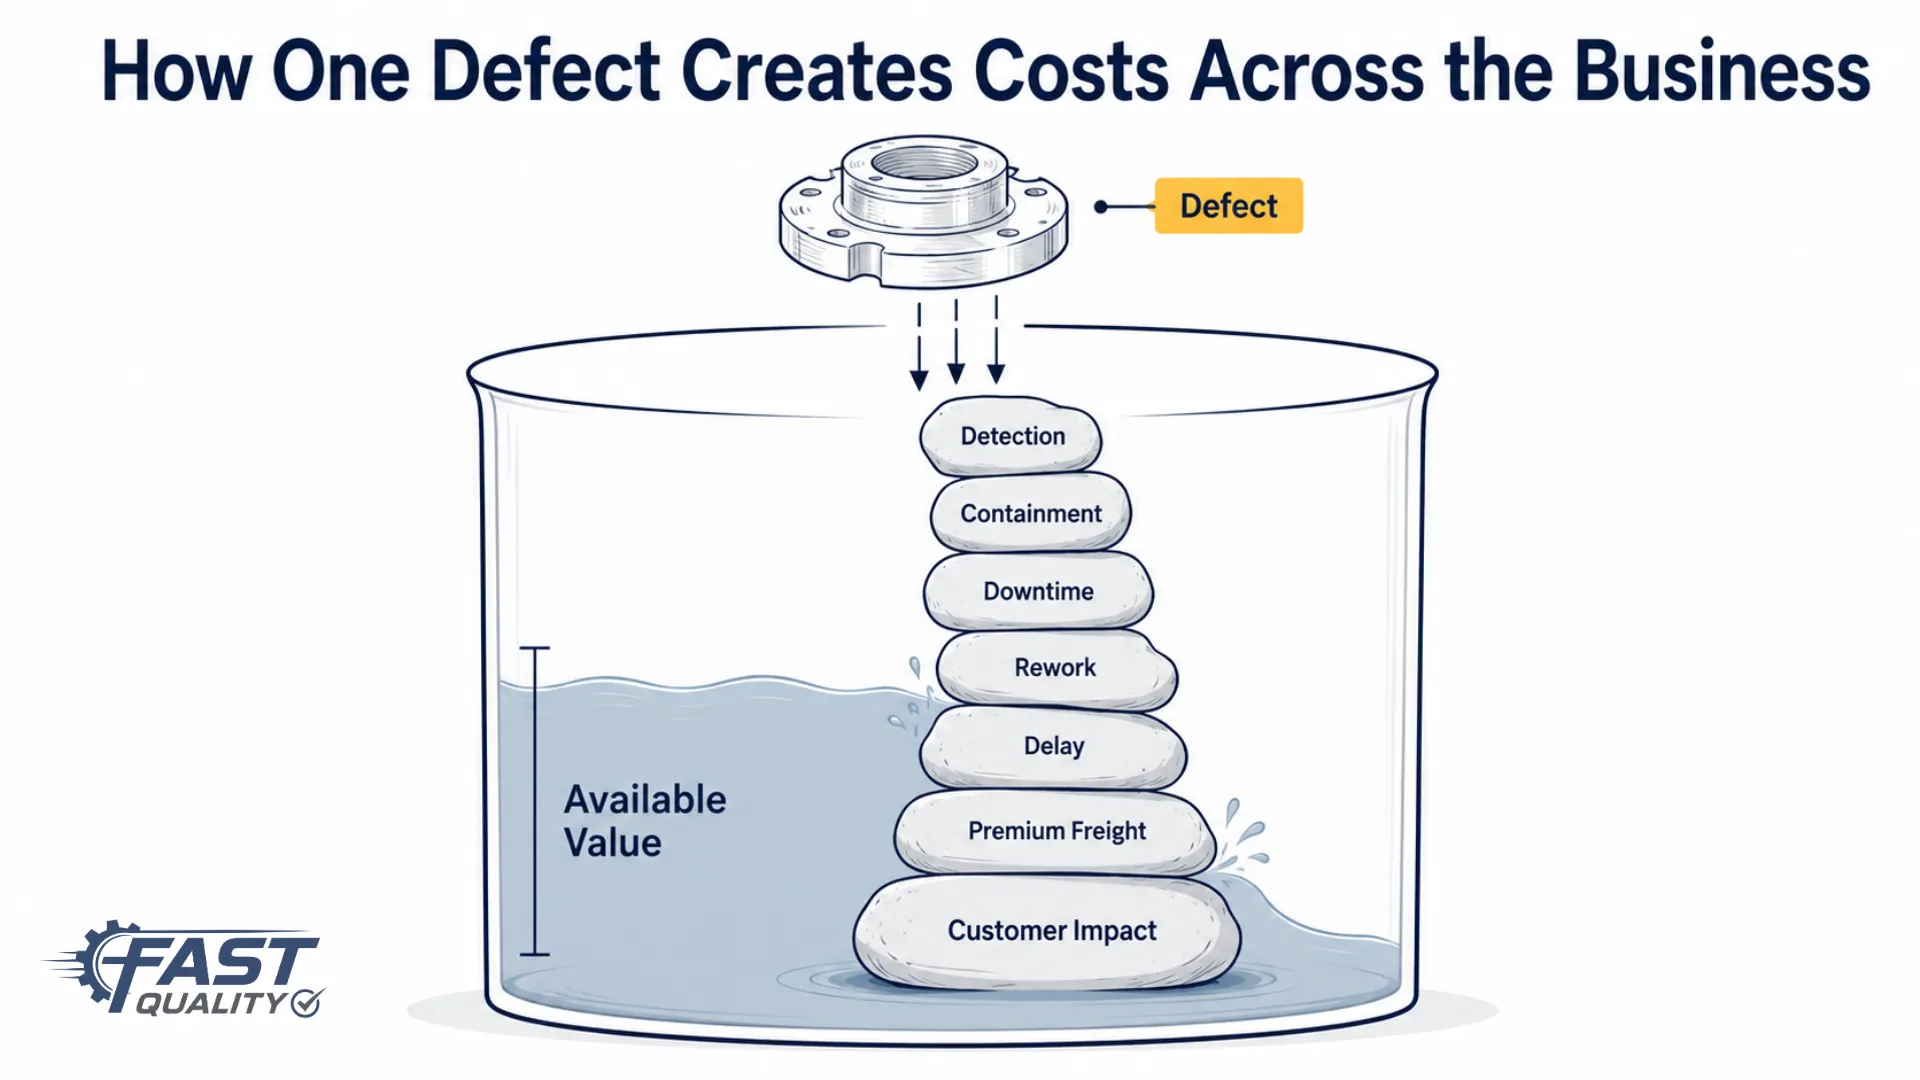
A single defect can generate costs across quality, production, maintenance, planning, logistics, finance, sales, and customer service simultaneously.
The defect is detected
Inspection identifies the variation. This adds inspection time, handling, documentation, segregation, and reporting effort.
The batch is contained
The remaining components must be isolated and sorted. Additional operators, inspectors, gauges, and floor space may be required to determine which parts are usable.
Production is disrupted
The machine may be stopped for investigation, tool replacement, parameter correction, or trial production. Planned output is lost while the issue is resolved.
Parts are reworked or scrapped
Rework consumes additional labour, machine time, tooling, electricity, and inspection. Components that cannot be recovered become scrap.
The production schedule changes
Replacement parts may need to be produced urgently. Other planned orders may be delayed, and overtime may be required to recover lost output.
Dispatch and logistics are affected
If the batch was meant for an urgent customer order, the manufacturer may need to arrange premium freight or a special delivery to avoid disrupting the customer's assembly line.
The customer impact begins
If the defect escapes the plant, it may lead to rejection, returns, complaint investigation, debit notes, warranty claims, supplier rating reductions, or loss of future business.
The key insight
COPQ is not a quality-department expense. It is a business-wide financial loss triggered by quality failure. The same defect can generate costs across quality, production, maintenance, planning, logistics, finance, sales, and customer service — all from a single rejected batch.
How to Calculate the True Cost of Poor Quality
Calculating COPQ does not require a perfect financial model on day one. The practical starting point is to identify the measurable costs created by quality failures and connect them to the original defect, process, product, machine, supplier, or customer complaint.
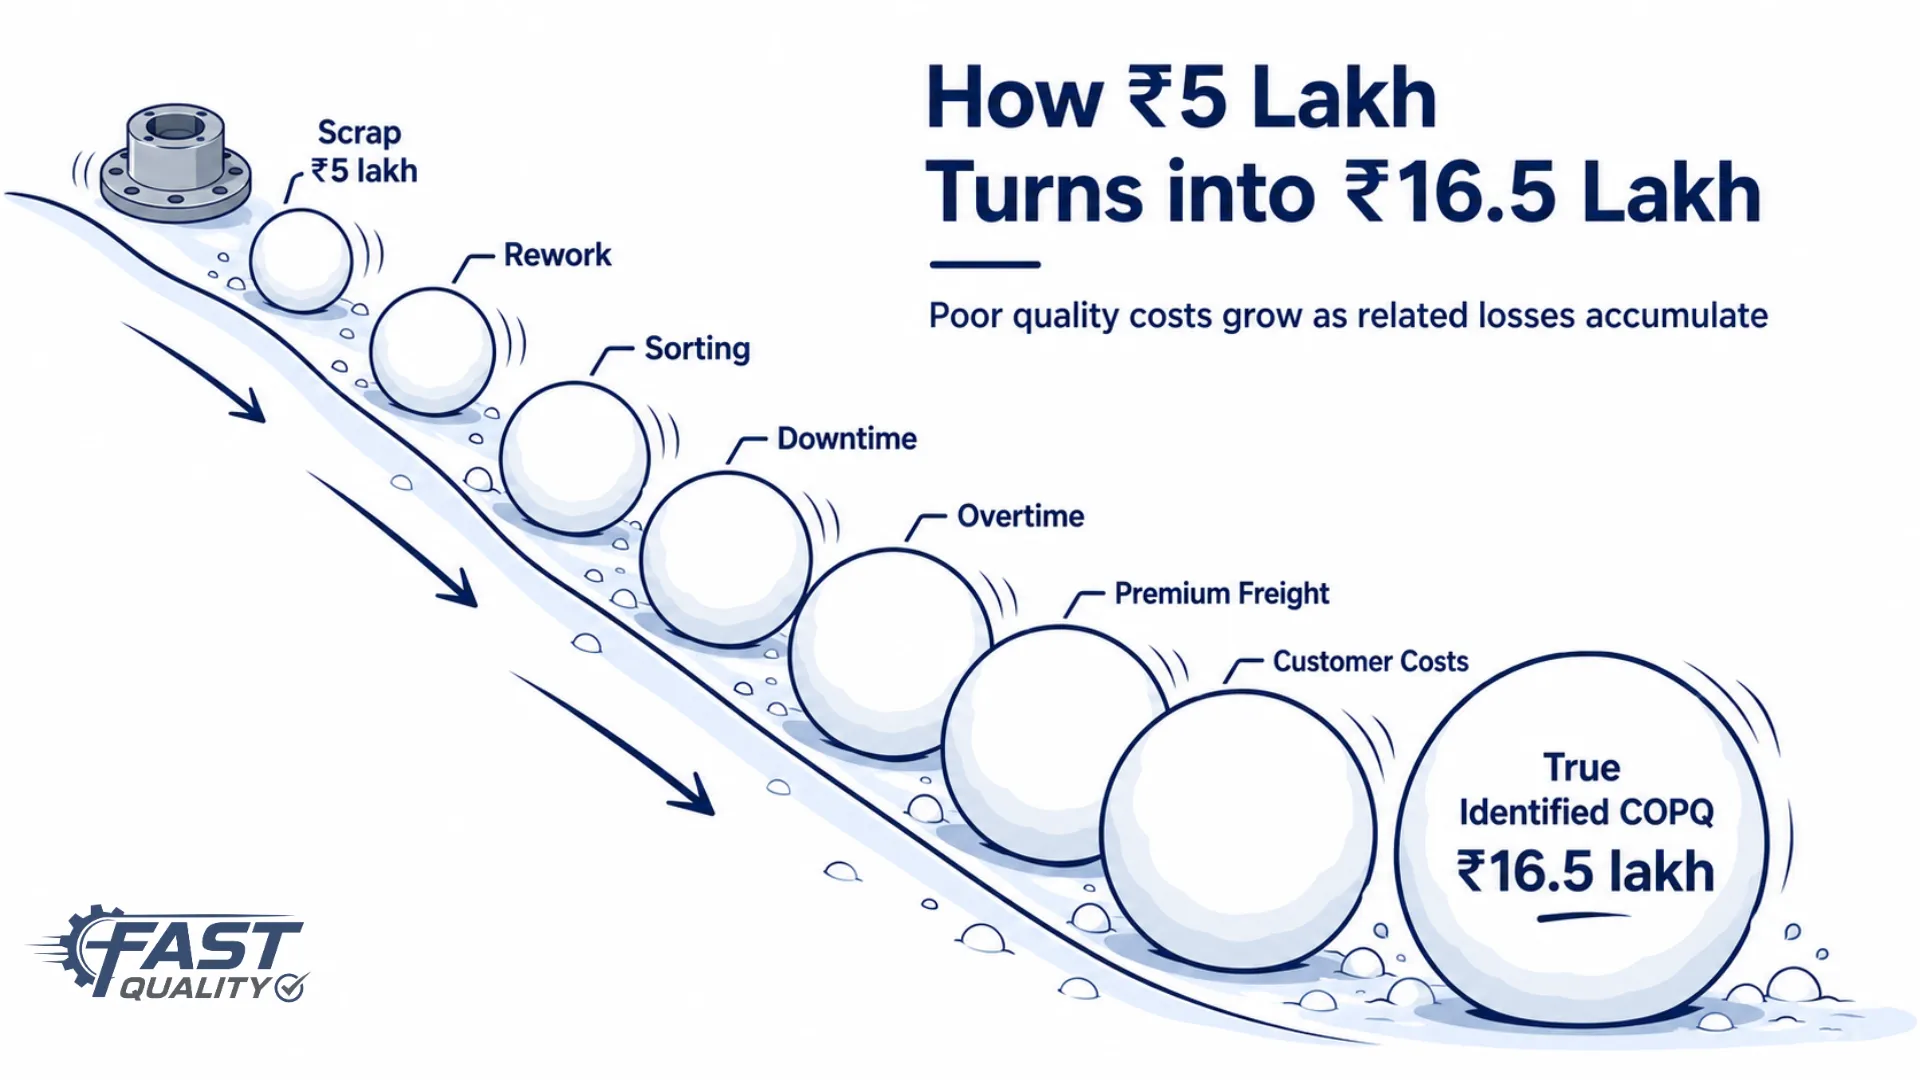
A real-world illustration of how ₹5 lakh in visible scrap becomes ₹16.5 lakh in total COPQ once all connected costs are identified.
An illustrative monthly COPQ calculation
Consider a mid-sized Indian auto components manufacturer reviewing the costs created by quality failures during one month:
| Cost Item | Monthly Cost |
|---|---|
| Scrap | ₹5,00,000 |
| Rework labour and consumables | ₹3,20,000 |
| Sorting and additional inspection | ₹1,10,000 |
| Production downtime | ₹2,40,000 |
| Overtime for output recovery | ₹80,000 |
| Premium freight | ₹1,25,000 |
| Customer debit notes and returns | ₹2,00,000 |
| Failure investigation and corrective action | ₹75,000 |
| Total identified COPQ | ₹16,50,000 |
The monthly report initially showed only ₹5 lakh in scrap. Once the related costs were connected to the same quality failures, the measurable COPQ increased to ₹16.5 lakh. That means the visible scrap figure represented less than one third of the identified loss.
And even this calculation may still exclude difficult-to-measure effects such as lost customer confidence, reduced supplier ratings, delayed future orders, or business lost to a competitor.

How Much Are Scrap, Rework and Warranty Claims Costing You?
Get the COPQ Calculator and Executive Guide delivered instantly via WhatsApp or Email.
Why the True Cost of Poor Quality Remains Hidden
Most manufacturers do not intentionally ignore poor-quality costs. The problem is that those costs are usually scattered across different departments, systems, and accounting categories.
Scrap may appear in the production report. Rework labour may sit under operations. Overtime may be recorded in payroll. Premium freight may appear as a logistics expense. Customer debit notes may be visible only to finance, while complaint-handling effort may remain within quality or customer service. Each department sees one part of the loss, but no one sees the complete picture.
Costs are recorded by department, not by cause
A premium freight charge may be classified as a logistics cost even when the shipment became urgent because a batch was rejected. Similarly, overtime may appear as a manpower cost, even though it was required to recover production lost during rework or machine correction. Unless these costs are linked back to the original quality event, they remain invisible within COPQ.
Lost capacity is rarely measured
Manufacturers often record the direct labour used for rework, but overlook the productive machine hours and operator time that could have been used to manufacture saleable parts. The real loss is not only the cost of rework — it is also the value of the output that was never produced.
Quality reports often focus on quantities
Defect counts, rejection percentages, and parts per million are important quality indicators, but they do not always reveal financial impact. A frequent surface defect may cost less than a rare dimensional failure that causes a customer line stoppage, emergency replacement production, and a large debit note.
The Most Frequent Defect May Not Be the Most Expensive
Manufacturers commonly use defect counts, rejection percentages, or parts per million to decide which quality problems require attention. These measures are useful, but they do not show the complete business impact.
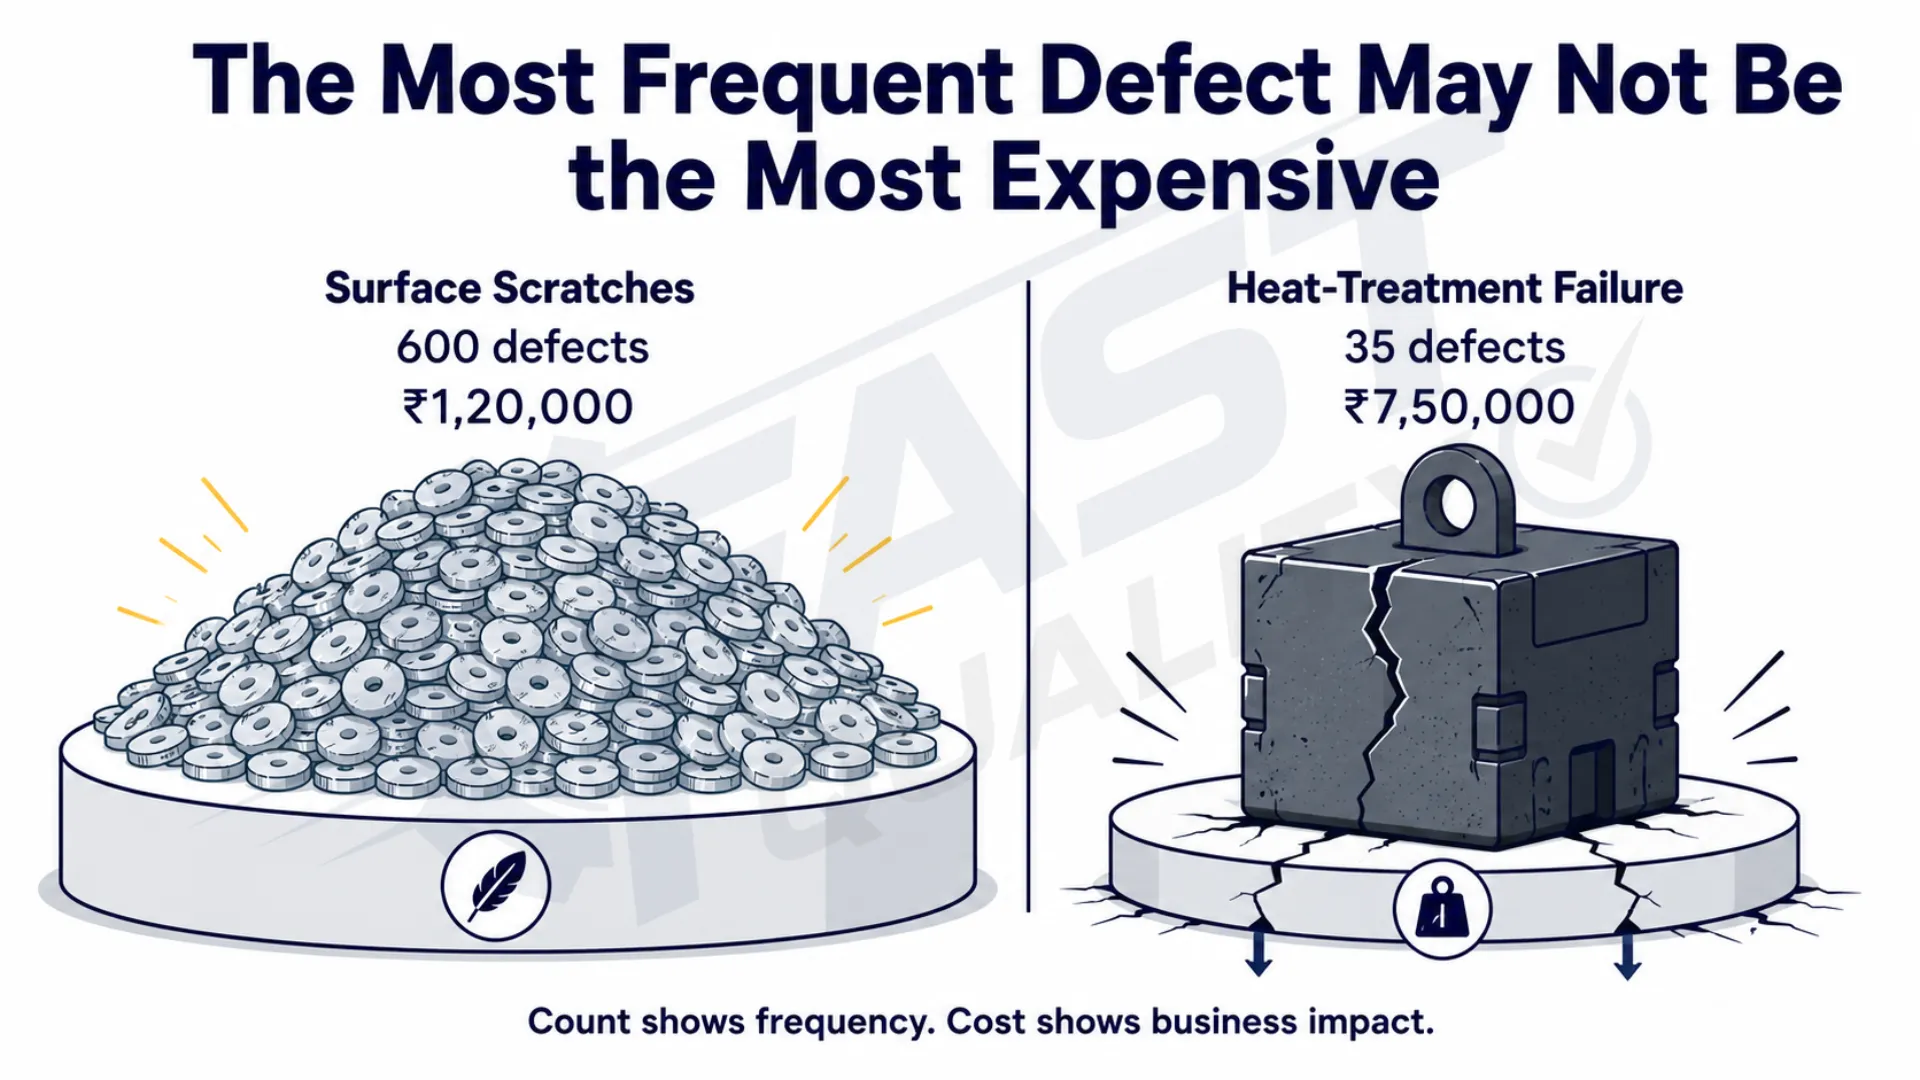
Ranking defects by frequency versus ranking by financial impact often reveals completely different priorities.
A defect occurring hundreds of times may create only a small repair cost. Another defect may occur rarely but cause major losses through batch rejection, customer line stoppage, emergency production, premium freight, or debit notes. Consider the following monthly data from an auto components operation:
| Defect Type | Number of Defects | Total Financial Impact |
|---|---|---|
| Surface scratches | 600 | ₹1,20,000 |
| Bore diameter variation | 180 | ₹4,80,000 |
| Heat-treatment failure | 35 | ₹7,50,000 |
| Packing damage | 90 | ₹90,000 |
If the company prioritises only by frequency, surface scratches appear to be the largest problem. But when the defects are ranked by financial impact, heat-treatment failure becomes the top priority — even though it occurred only 35 times.
"Count tells you how often the problem occurs. COPQ tells you how much the problem matters."
This is why manufacturers should use both a defect-count Pareto and a COPQ Pareto. The first shows where defects happen most often. The second shows where the business loses the most money.
A Practical Framework for Reducing COPQ
Measuring COPQ is useful only when it leads to better decisions and lower losses. A practical reduction programme can be built around six steps:
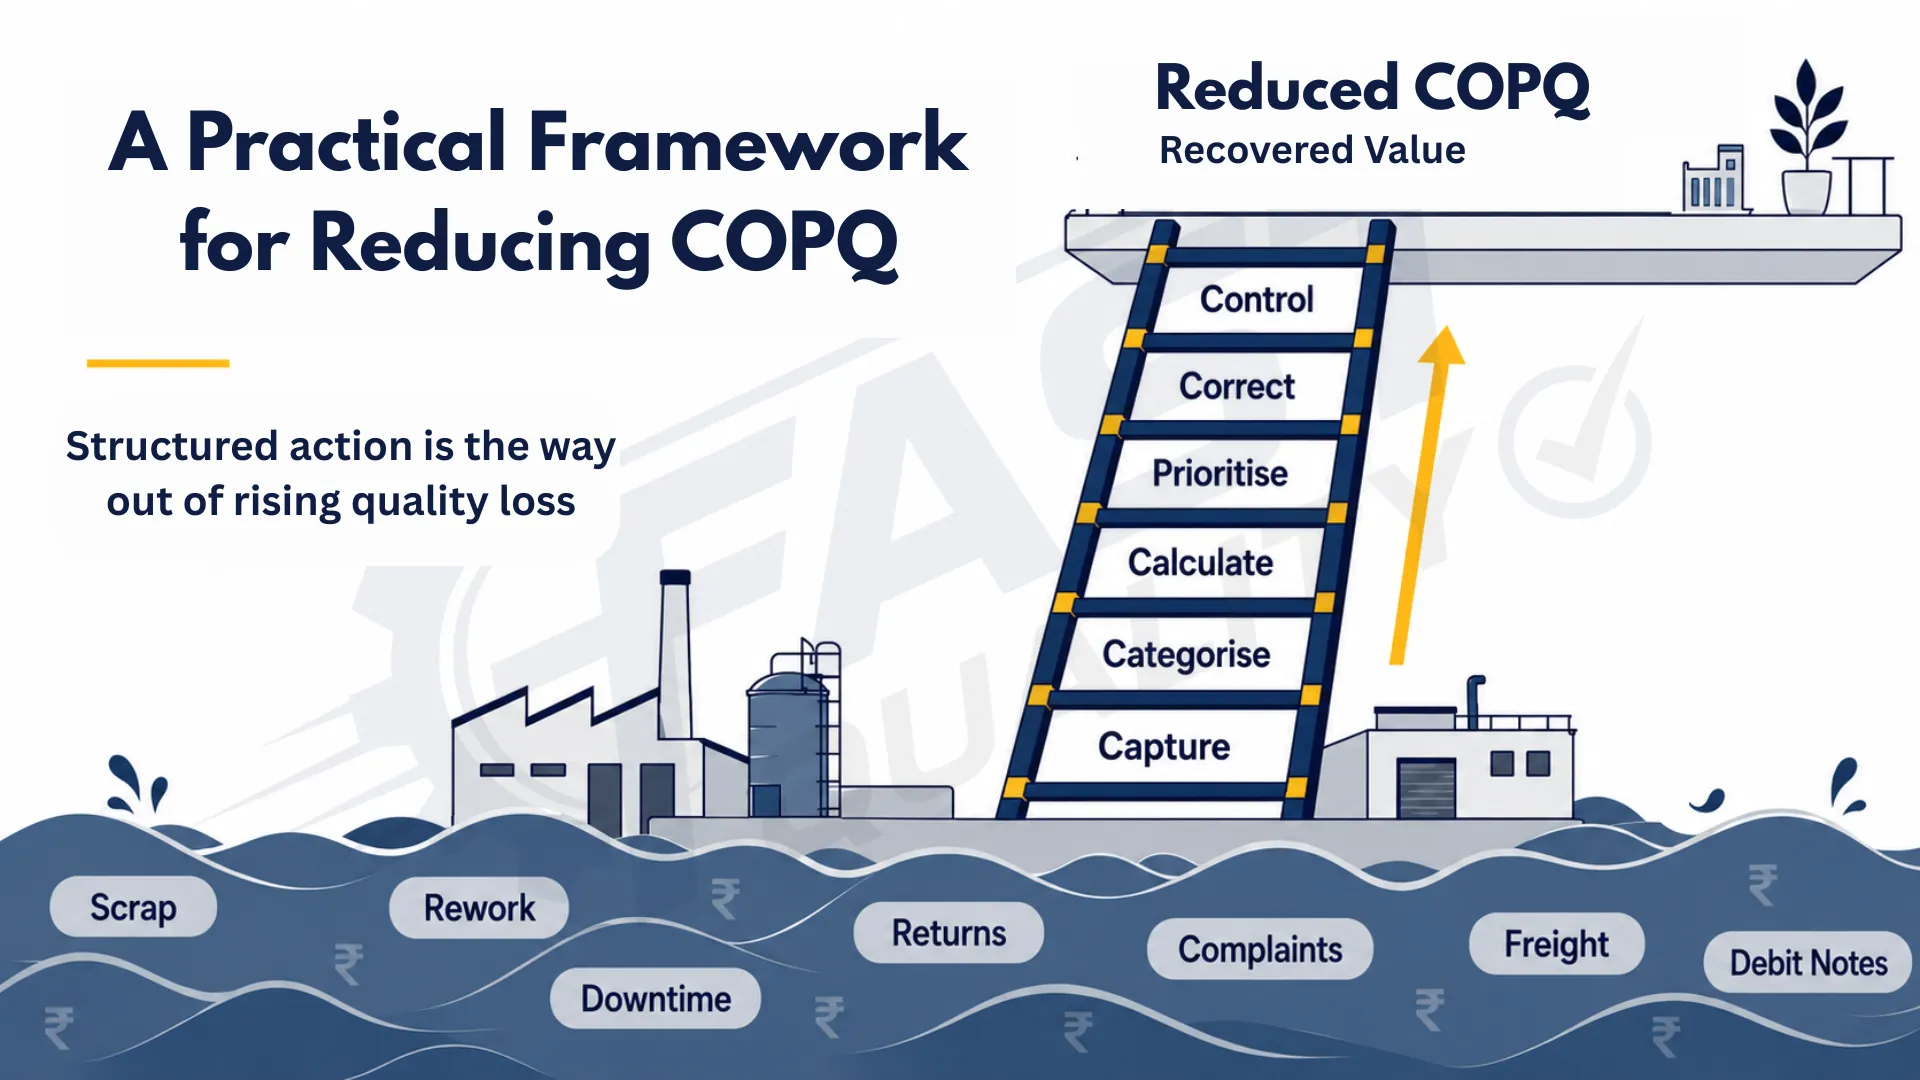
A structured six-step approach to identifying, prioritising, and eliminating COPQ from manufacturing operations.
Capture the full cost
Collect failure-related costs from all relevant functions, not only from the quality department. This includes production, quality, maintenance, planning, logistics, finance, and customer service. The aim is to connect each cost to the quality event that caused it.
Categorise the loss
Classify the identified costs into internal failure costs, external failure costs, and operational losses linked to poor quality. This creates a consistent structure for analysis and reporting.
Convert the impact into money
Use actual financial values: material cost, labour rate, machine hour rate, inspection cost, freight cost, debit note value, warranty cost, and lost production value. Where exact data is unavailable, reasonable estimates can be refined over time.
Prioritise by financial impact
Create a COPQ Pareto to identify the few problems responsible for the largest losses. This helps prevent teams from spending most of their time on defects that are frequent but financially insignificant.
Correct the root cause
Use the most suitable problem-solving method: 5 Whys, cause-and-effect analysis, 8D, CAPA, Statistical Process Control, process capability analysis, MSA, or mistake-proofing. The method matters less than whether it removes the real source of the loss.
Verify and control the result
Confirm whether the change has reduced scrap, rework, downtime, complaints, returns, freight, debit notes, and total COPQ. A corrective action is successful only when the financial loss decreases and the improvement is sustained.
"Closing an action is an activity. Reducing COPQ is the result."
What Should a COPQ Dashboard Show?
For COPQ to drive decisions, it needs to be visible in a format that quality leaders and management can act on quickly. A practical dashboard brings the right data together in one place.
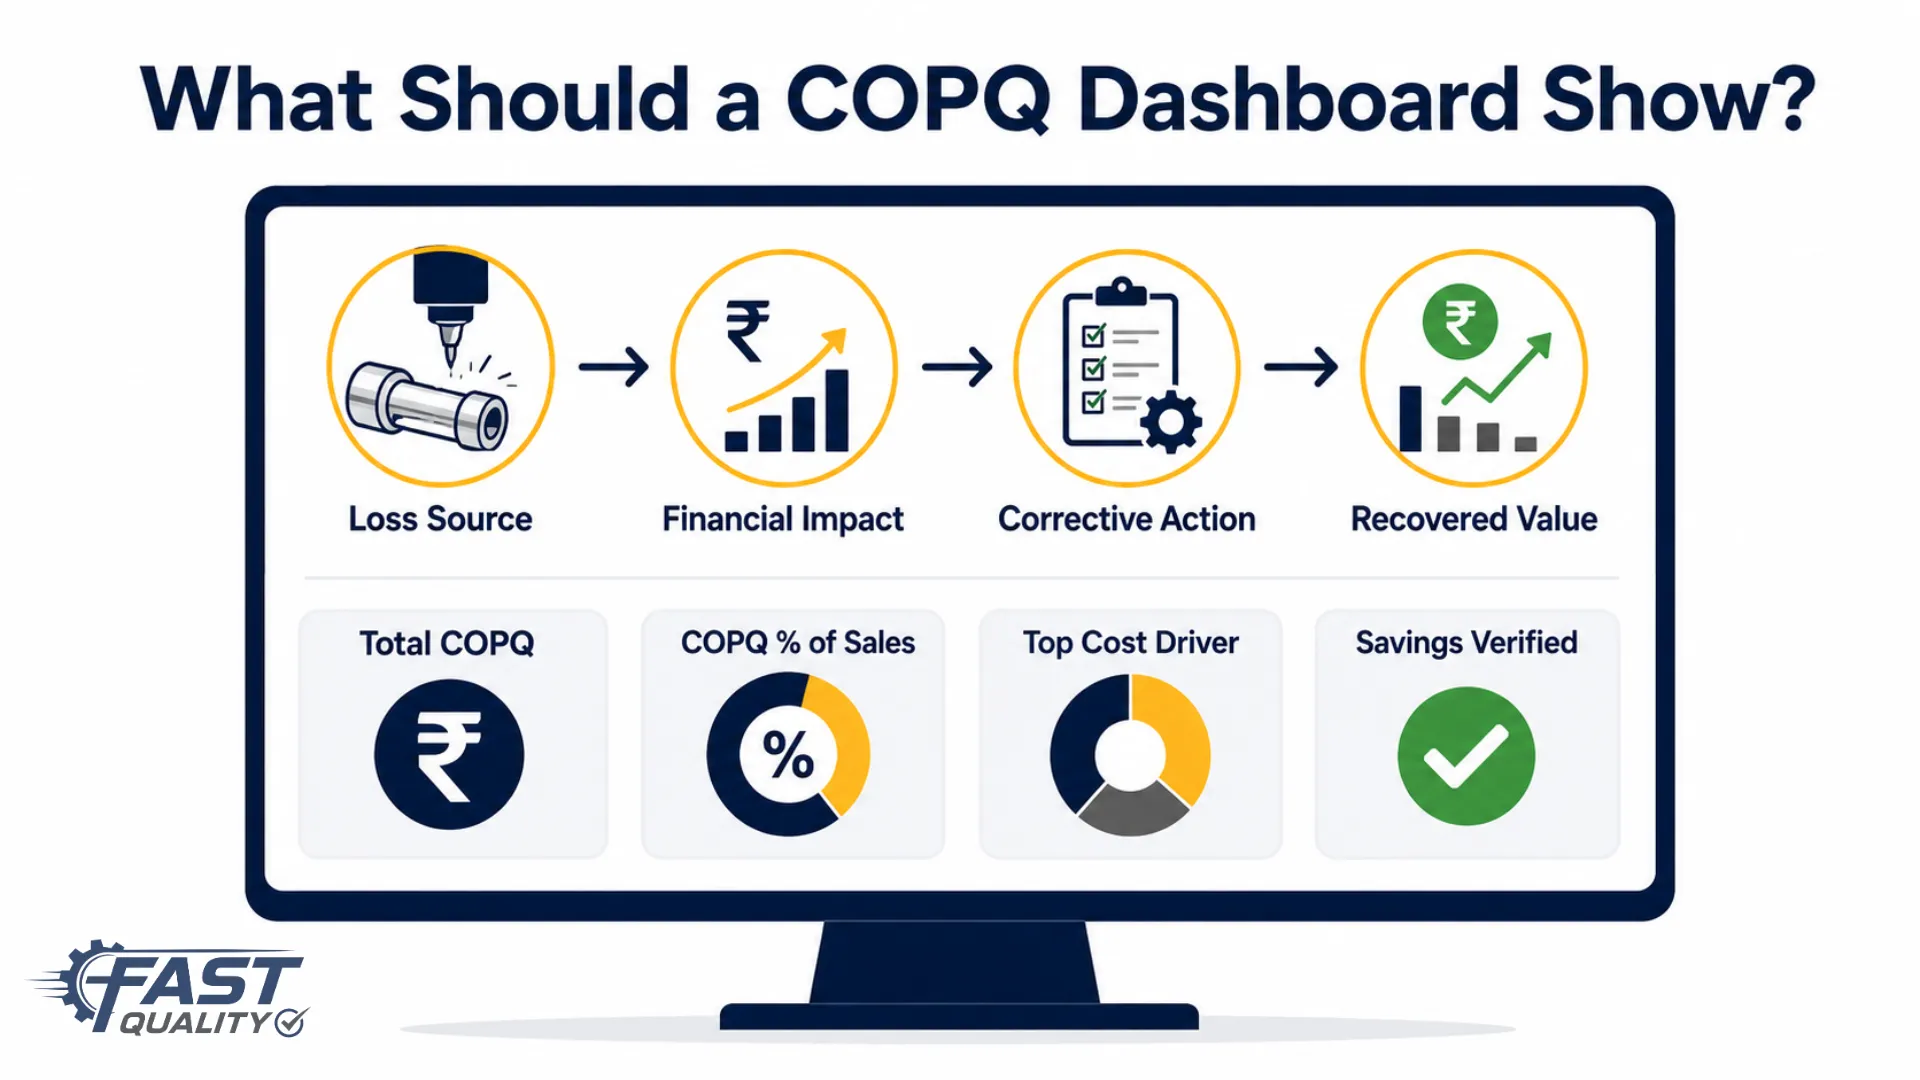
A COPQ dashboard should connect defect data with financial impact, making quality losses visible enough to act upon.
An effective COPQ dashboard should show COPQ reviewed by defect type, machine or production line, product family, supplier, customer complaint, and process stage. The goal is to make quality loss visible enough to identify where improvement creates the greatest financial impact.
From Quality Loss to Business Value
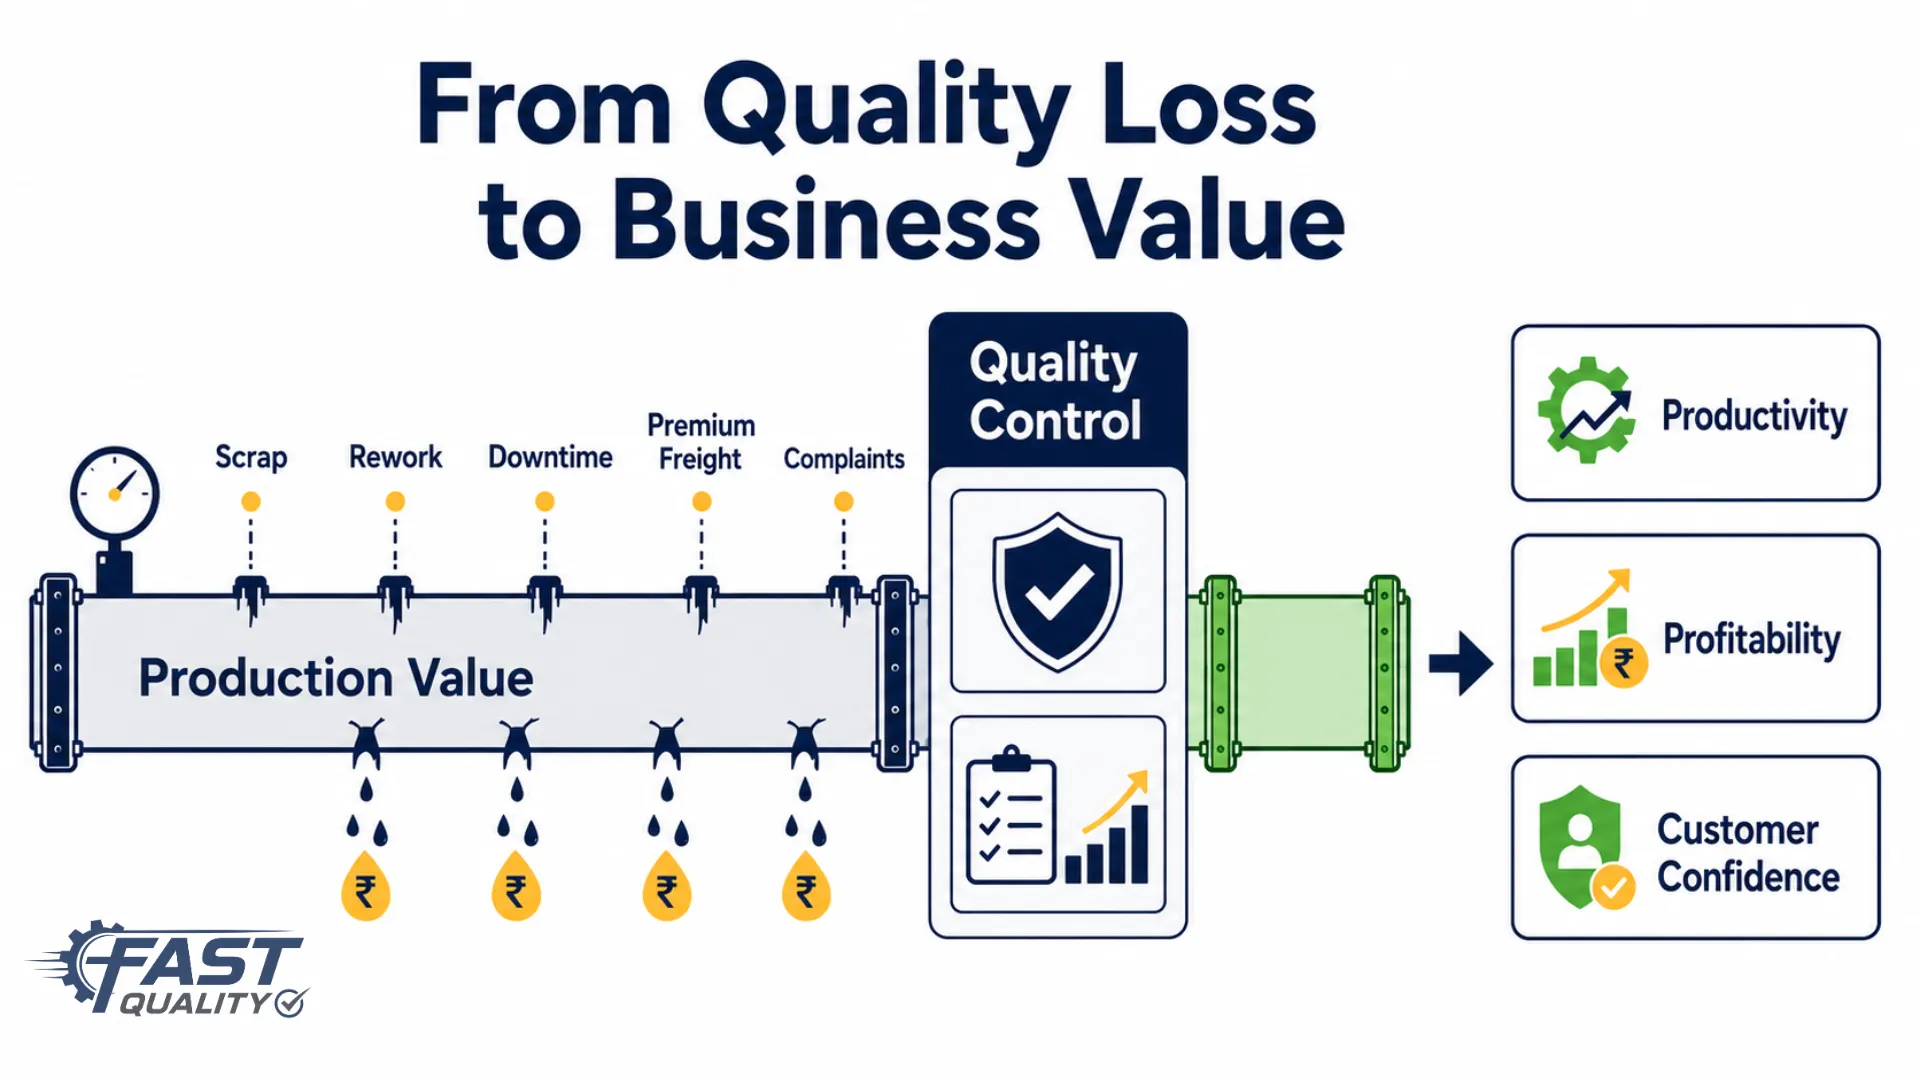
A structured COPQ approach transforms scattered quality losses into visible, actionable business intelligence.
Scrap and rework are important measures, but they rarely reveal the complete financial impact of poor quality. The true loss may also include downtime, sorting, overtime, delayed production, premium freight, debit notes, customer complaints, warranty claims, and capacity consumed by corrective work.
When these costs remain scattered across departments, quality problems can continue for months without the business understanding their real impact. A structured COPQ approach changes that. It helps manufacturers:
- Connect defects with financial loss
- Prioritise improvement projects by business impact
- Justify investment in prevention and process control
- Measure the value created by corrective actions
- Reduce recurring internal and external failure costs
The objective is not simply to calculate a larger number. It is to make quality loss visible enough to act upon.
Can Your Plant Answer These Three Questions?
What was our total COPQ last month?
Which three failures created the highest financial loss?
Did completed corrective actions reduce those costs?
If these questions cannot be answered confidently, the business may still be measuring only the portion of poor quality that is easiest to see. The first step in reducing COPQ is to stop measuring only what is visible.