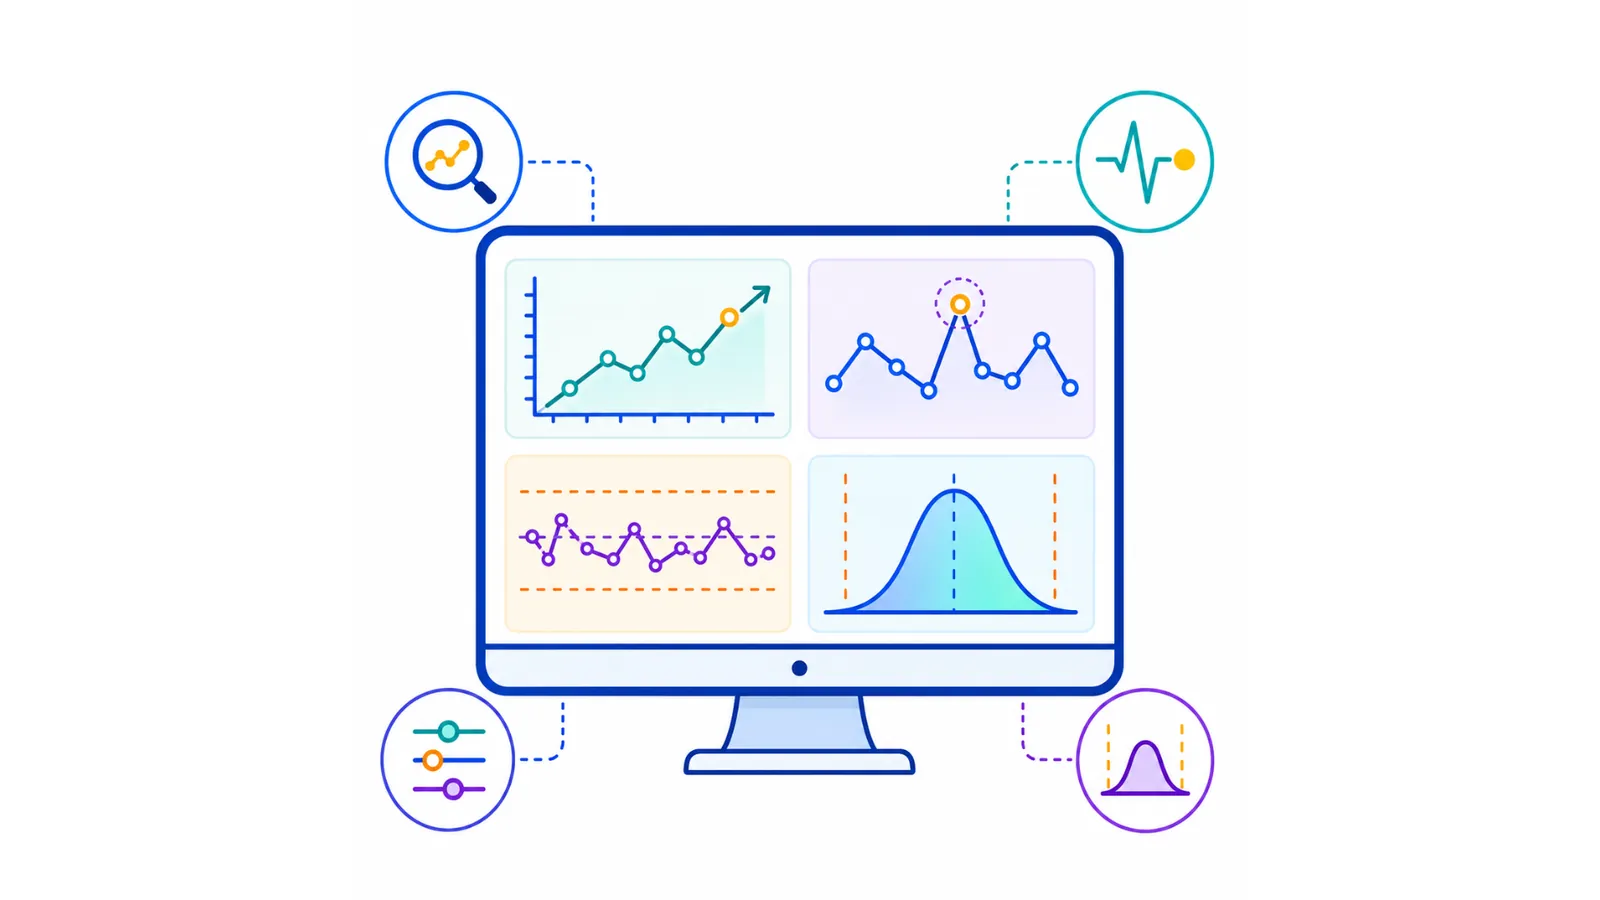
Key Features
Convert live process data into charts, signals and improvement visibility.
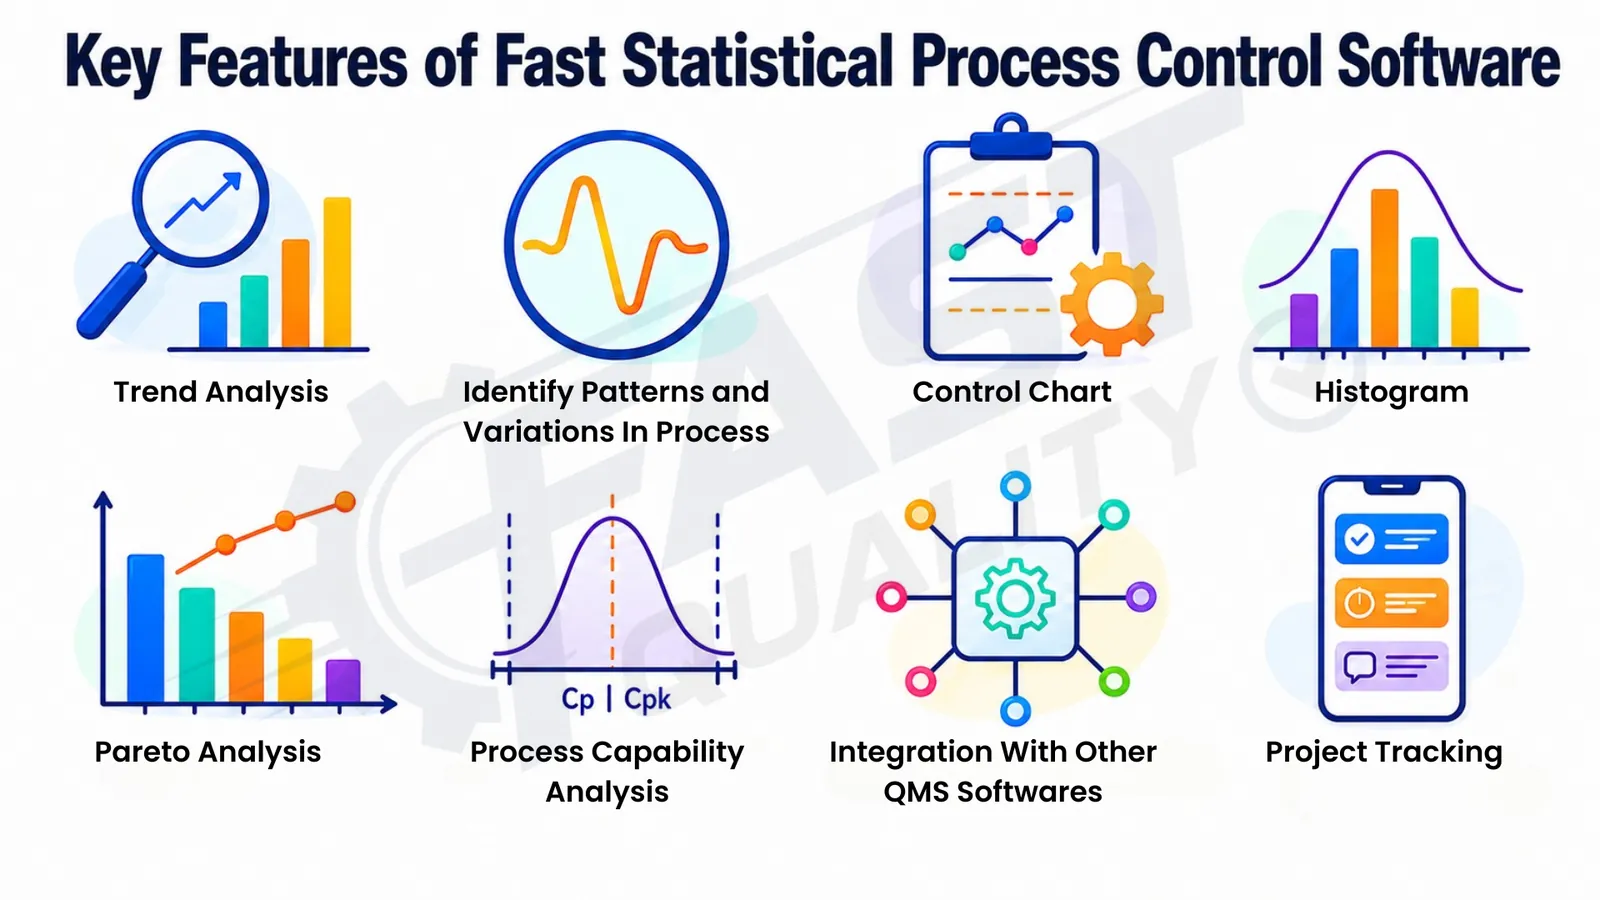
- Trend analysis and control charts
- Pattern and variation detection
- Histograms and Pareto analysis
- Project tracking for improvement actions
FAST SPC Software helps quality and production teams monitor process performance, detect unusual variation, analyse process capability and respond faster using real-time control charts and centralized SPC data.
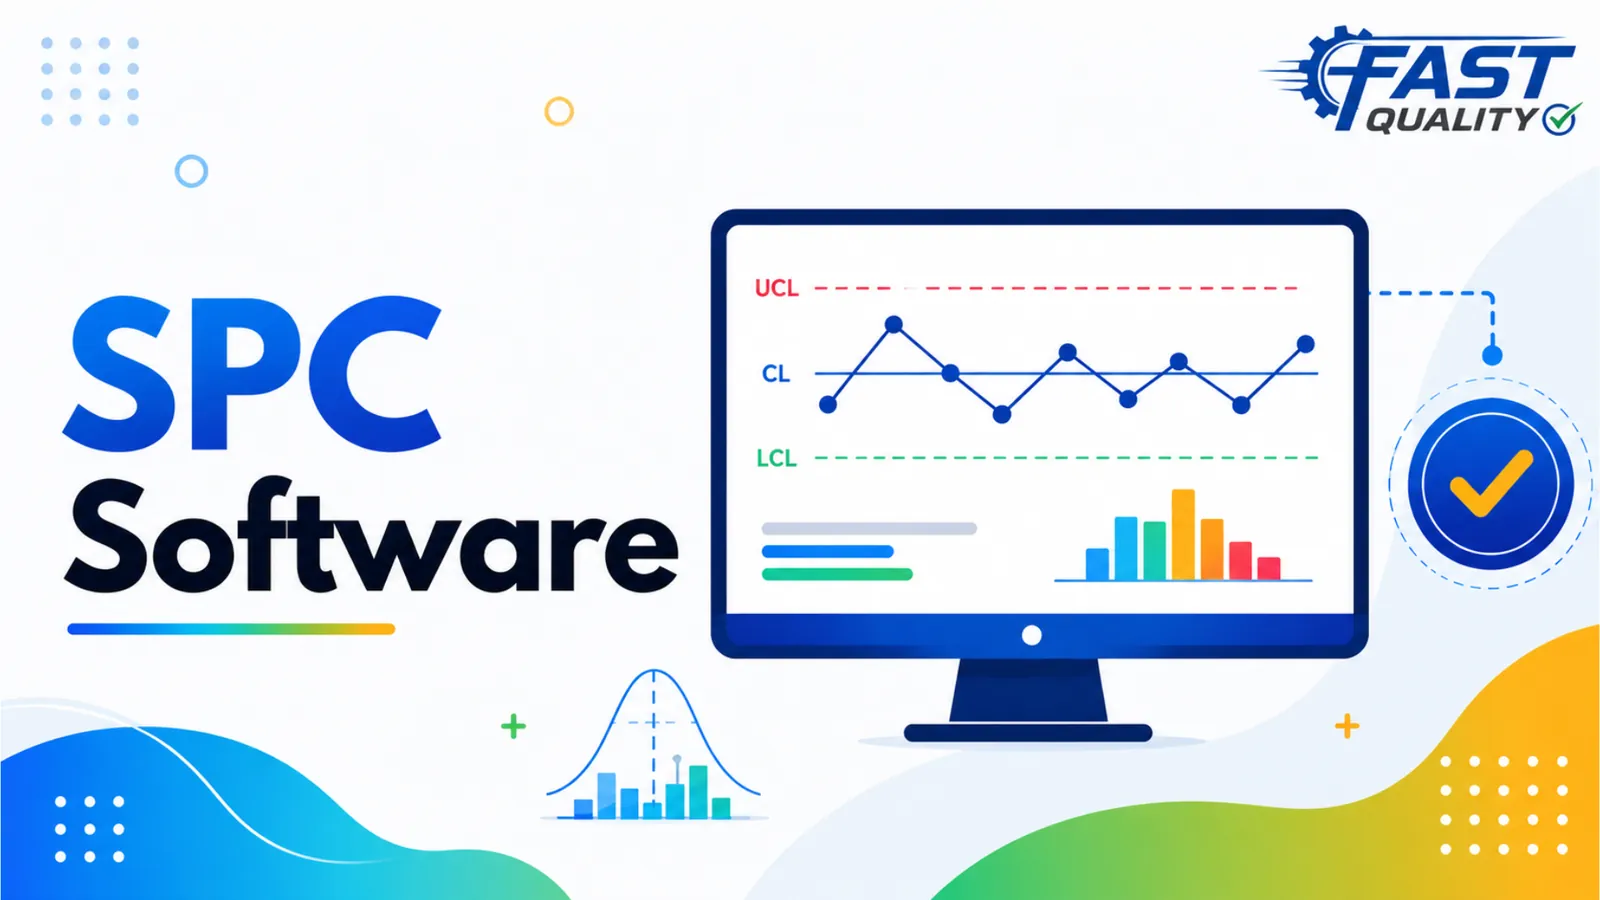
FAST SPC Software brings control charts, process trends, variation analysis and capability insights into one connected system, helping teams act before defects and rework increase.
Convert live process data into charts, signals and improvement visibility.
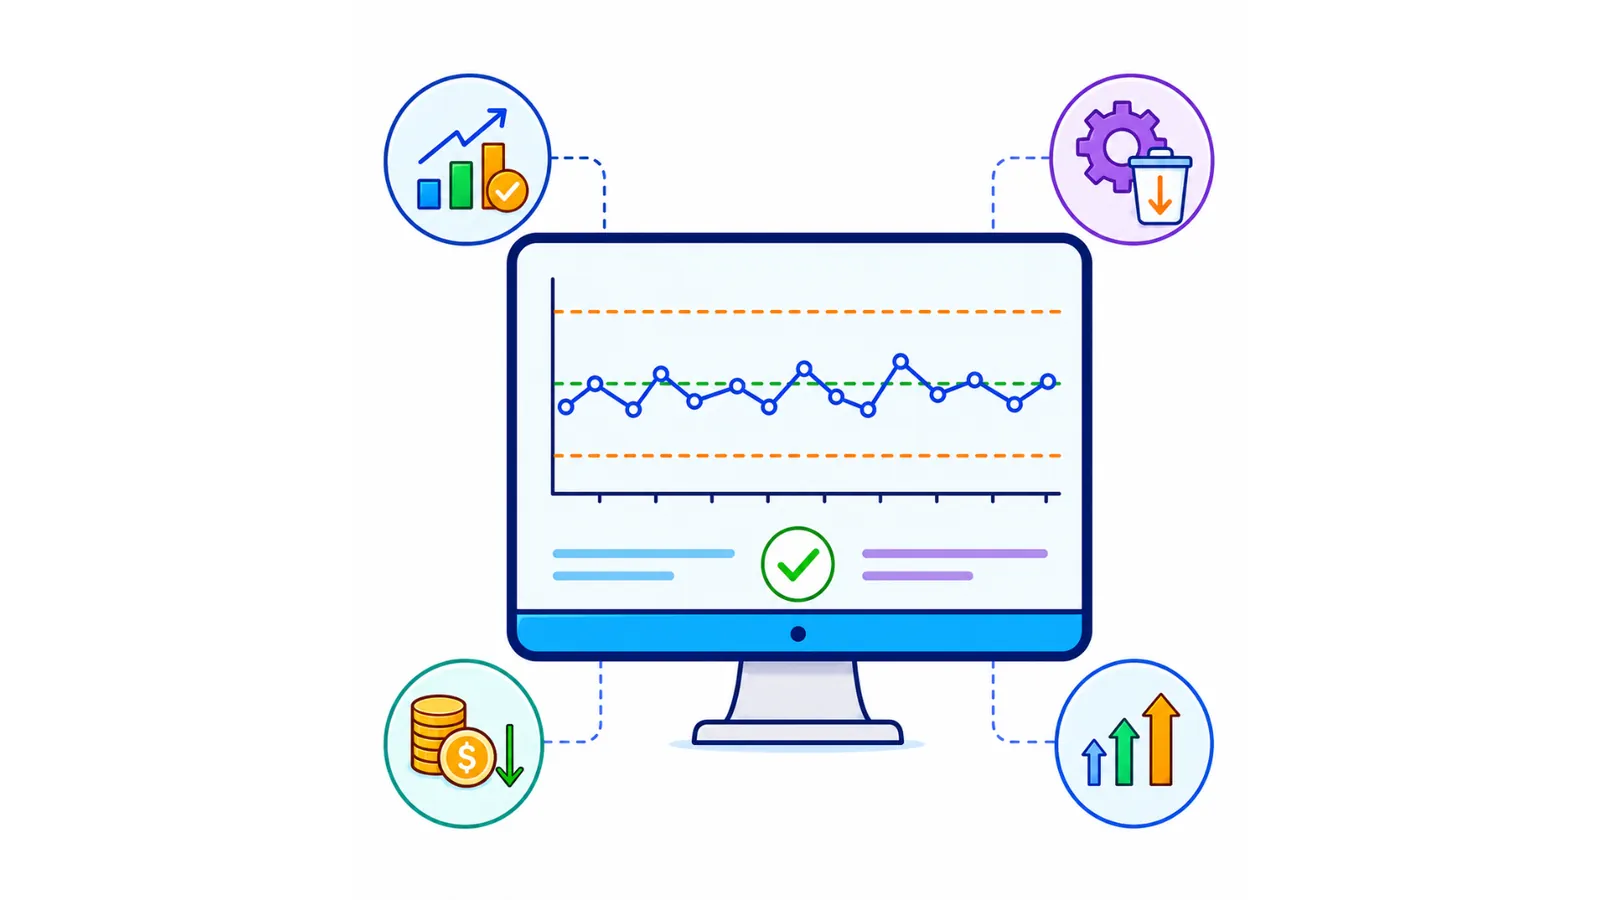
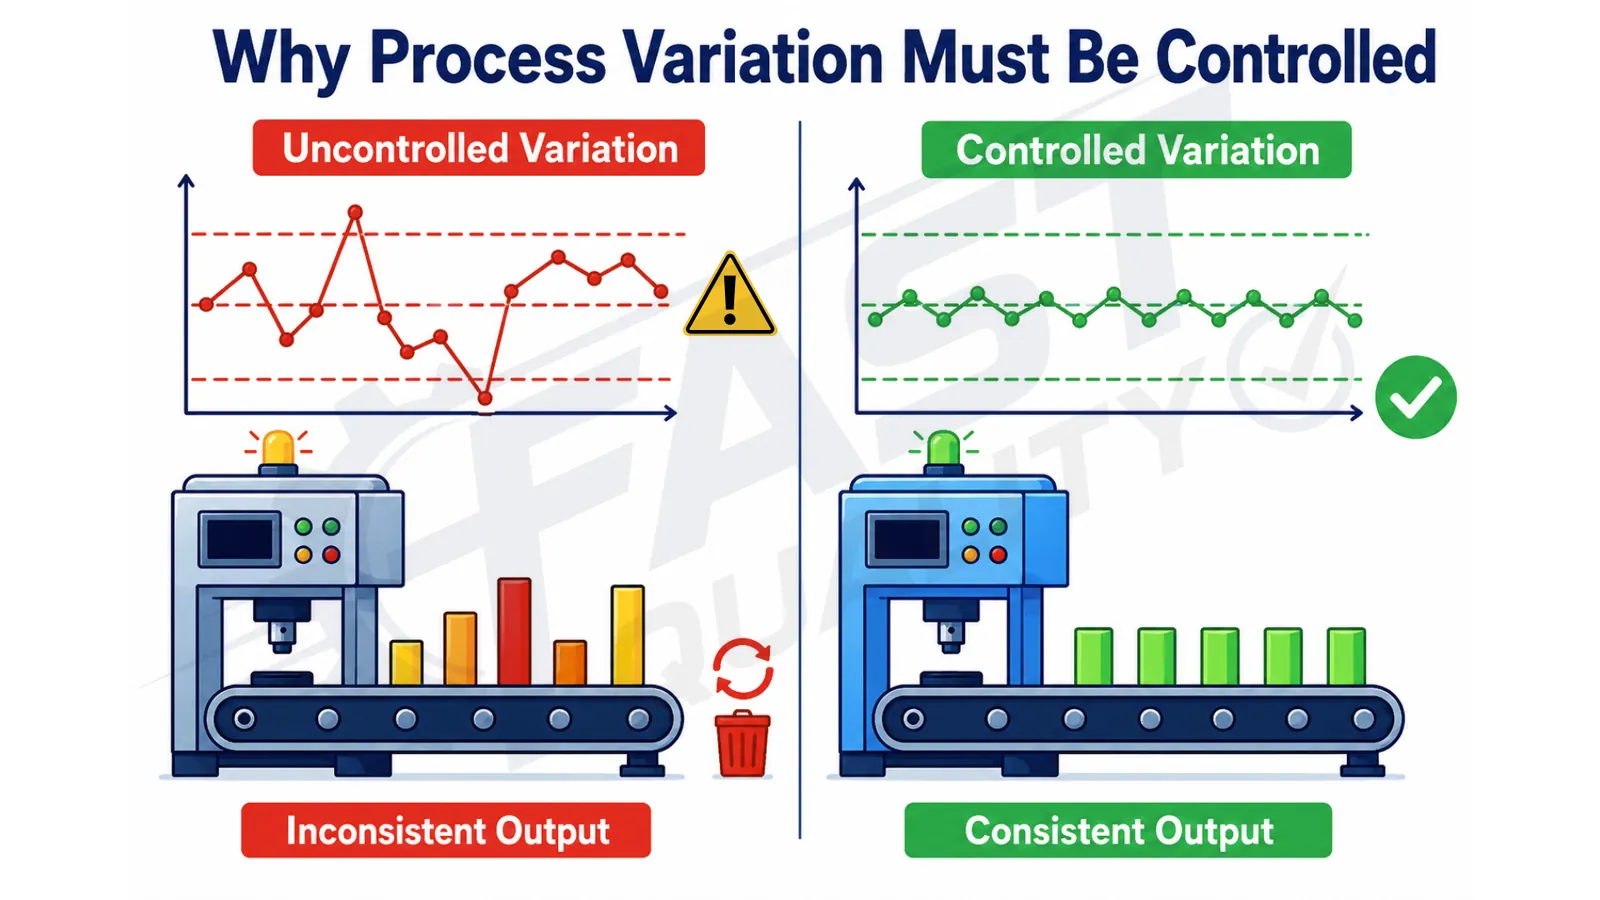
Reduce quality loss by controlling variation earlier in the process.
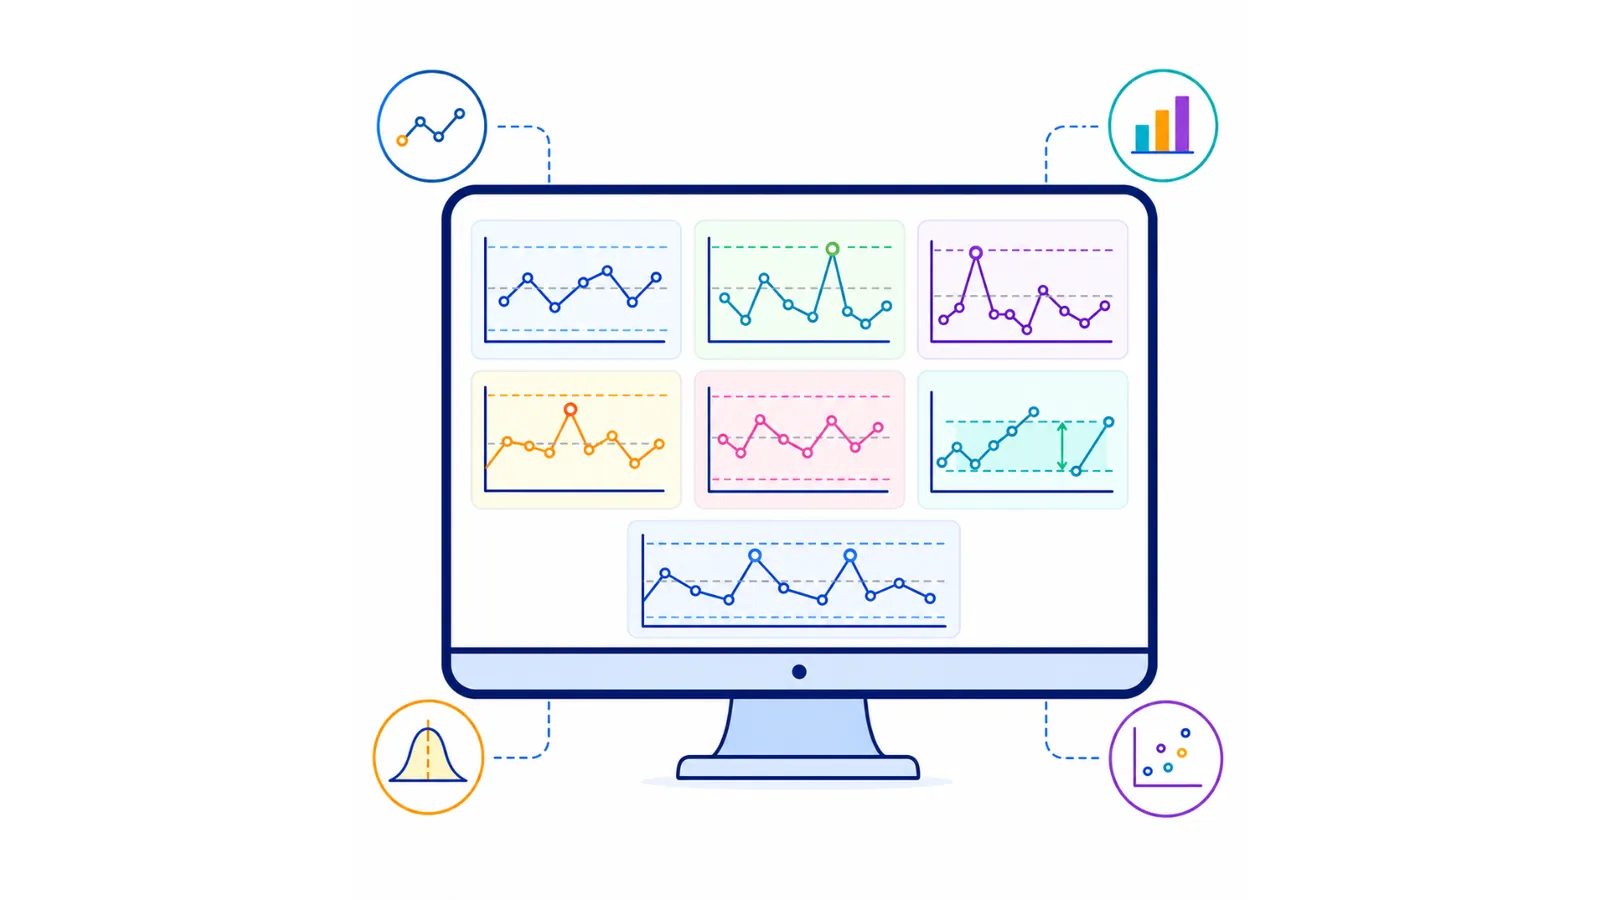
Use the right chart for measured values, defective units and defect counts.
FAST SPC Software helps teams monitor process behaviour, identify unusual variation, evaluate capability and track improvement activities through connected statistical tools and centralized quality data.
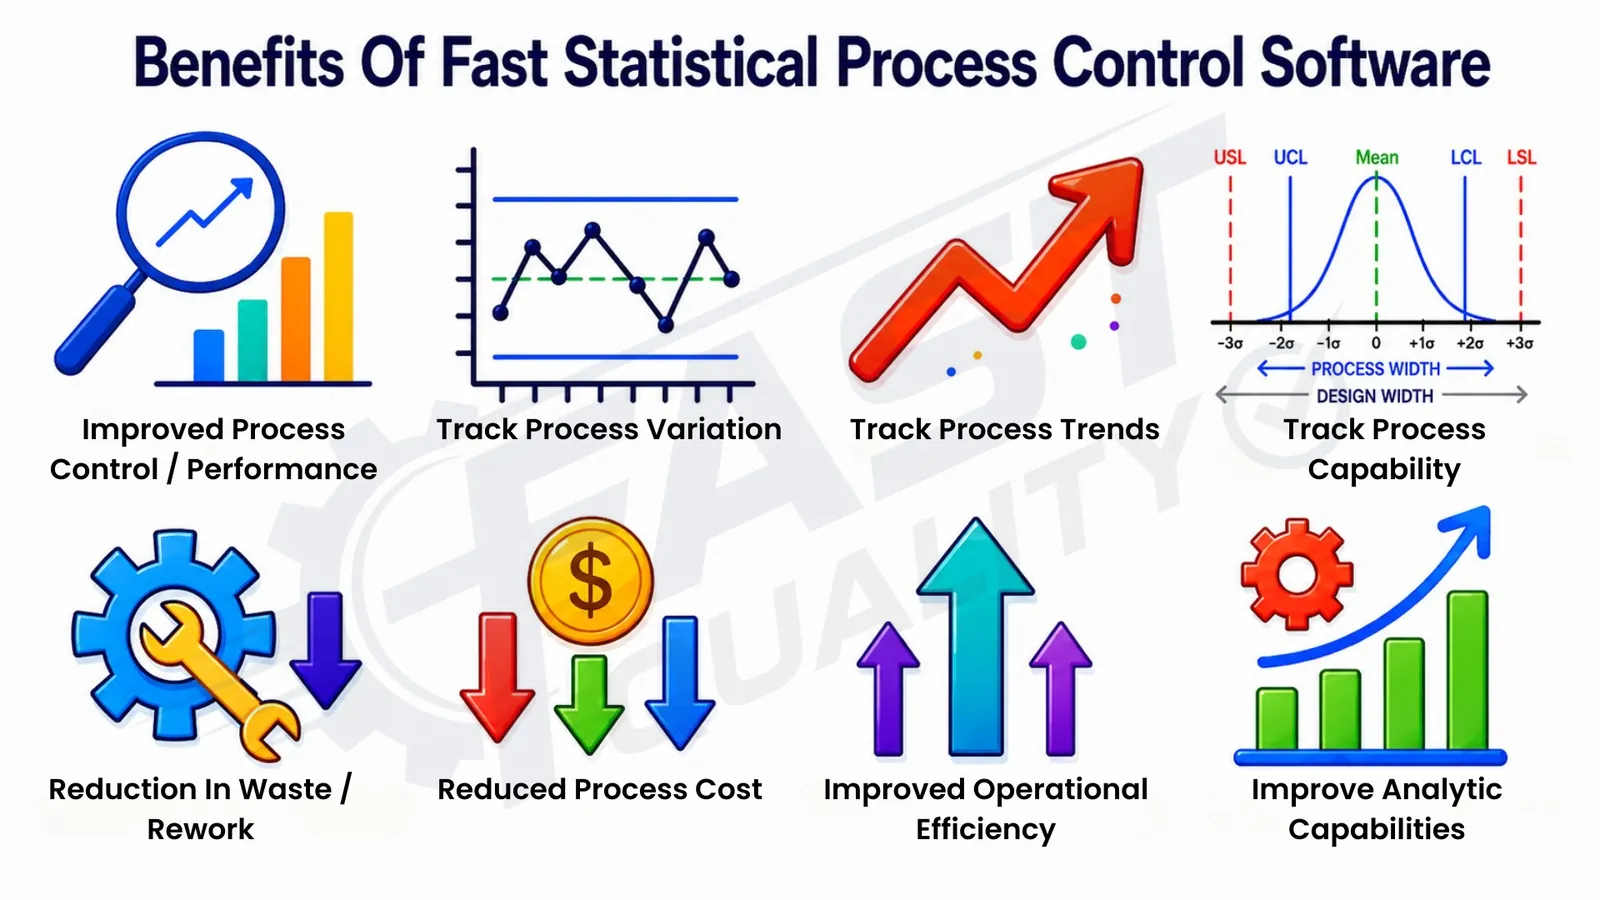
FAST SPC Software supports earlier problem detection, more stable production and better decisions across quality and manufacturing activities.
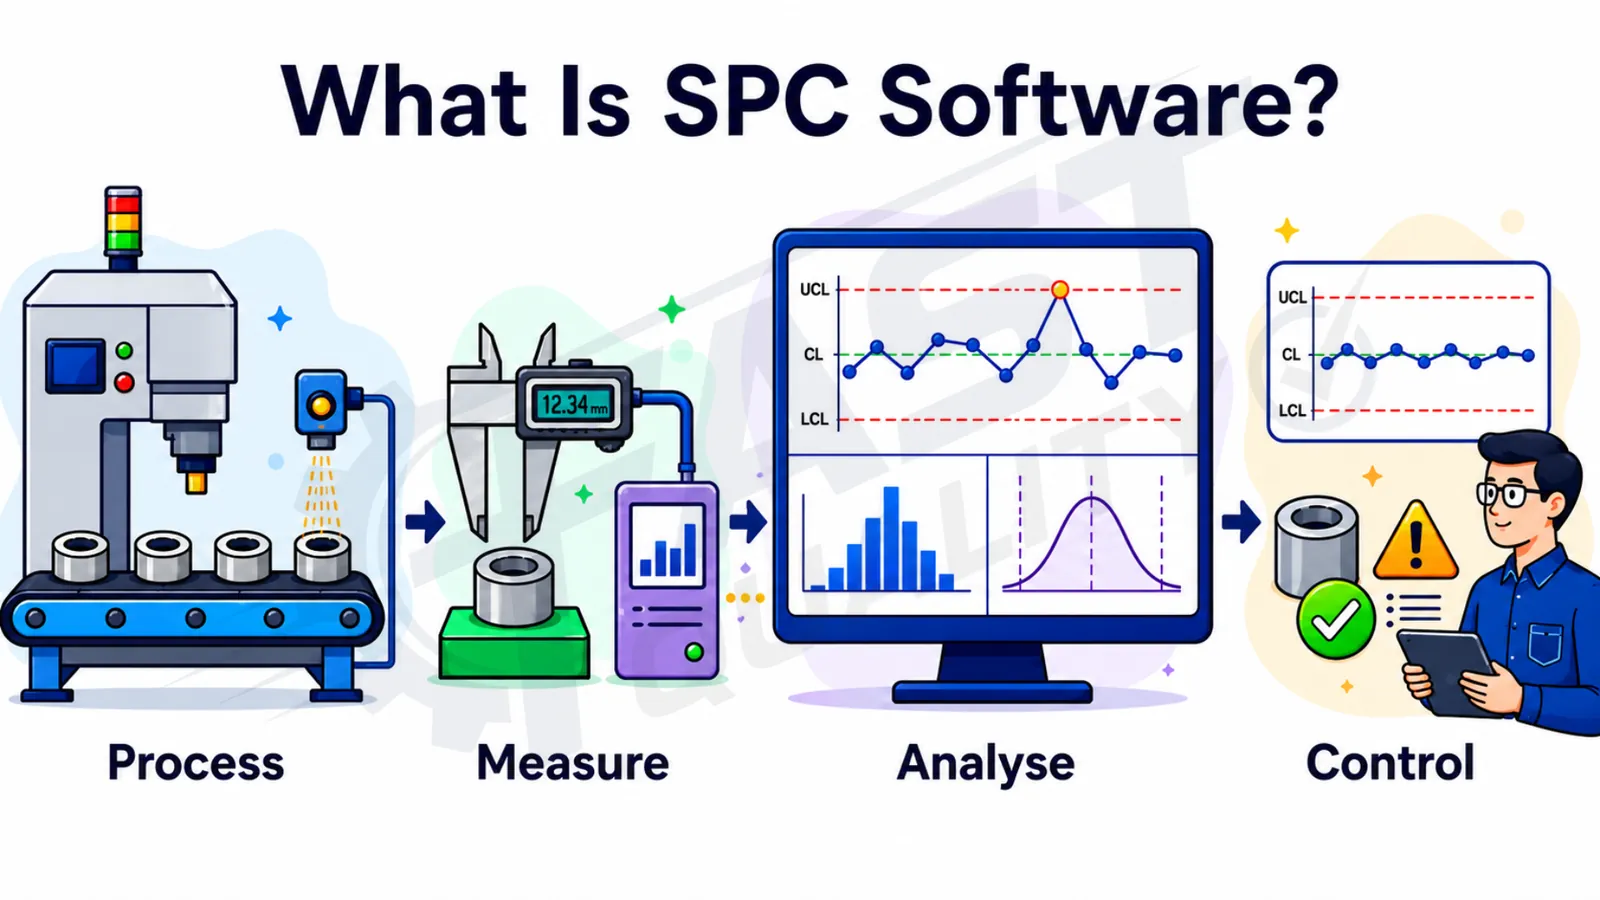
Statistical Process Control software is a digital system used to collect, analyse and monitor process data over time. It helps teams understand whether a process is operating normally or whether unusual variation is affecting quality, consistency or performance.
Instead of relying on delayed spreadsheet analysis, FAST SPC Software centralizes process data and presents it through control charts, trends, capability results and visual statistical reports.
Understand whether variation remains within normal process behaviour.
Identify shifts, patterns and out-of-control signals that may indicate a special cause.
Every process produces variation from materials, machines, methods, operators, measurement systems and environment. Natural variation may be expected, but unusual or increasing variation can make output unstable and difficult to predict.
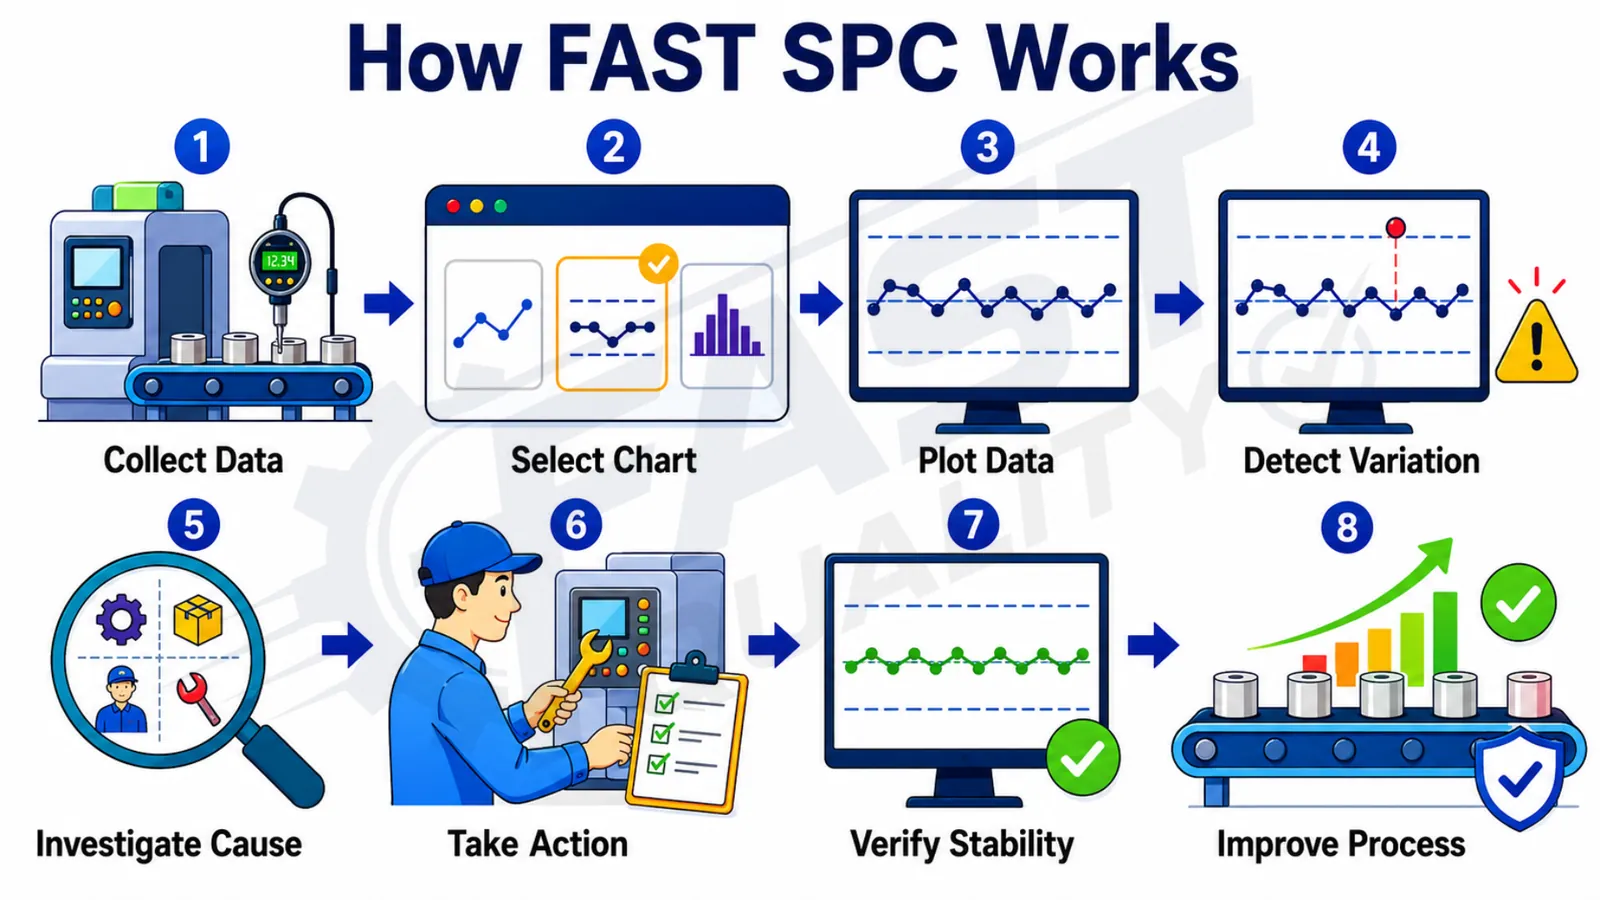
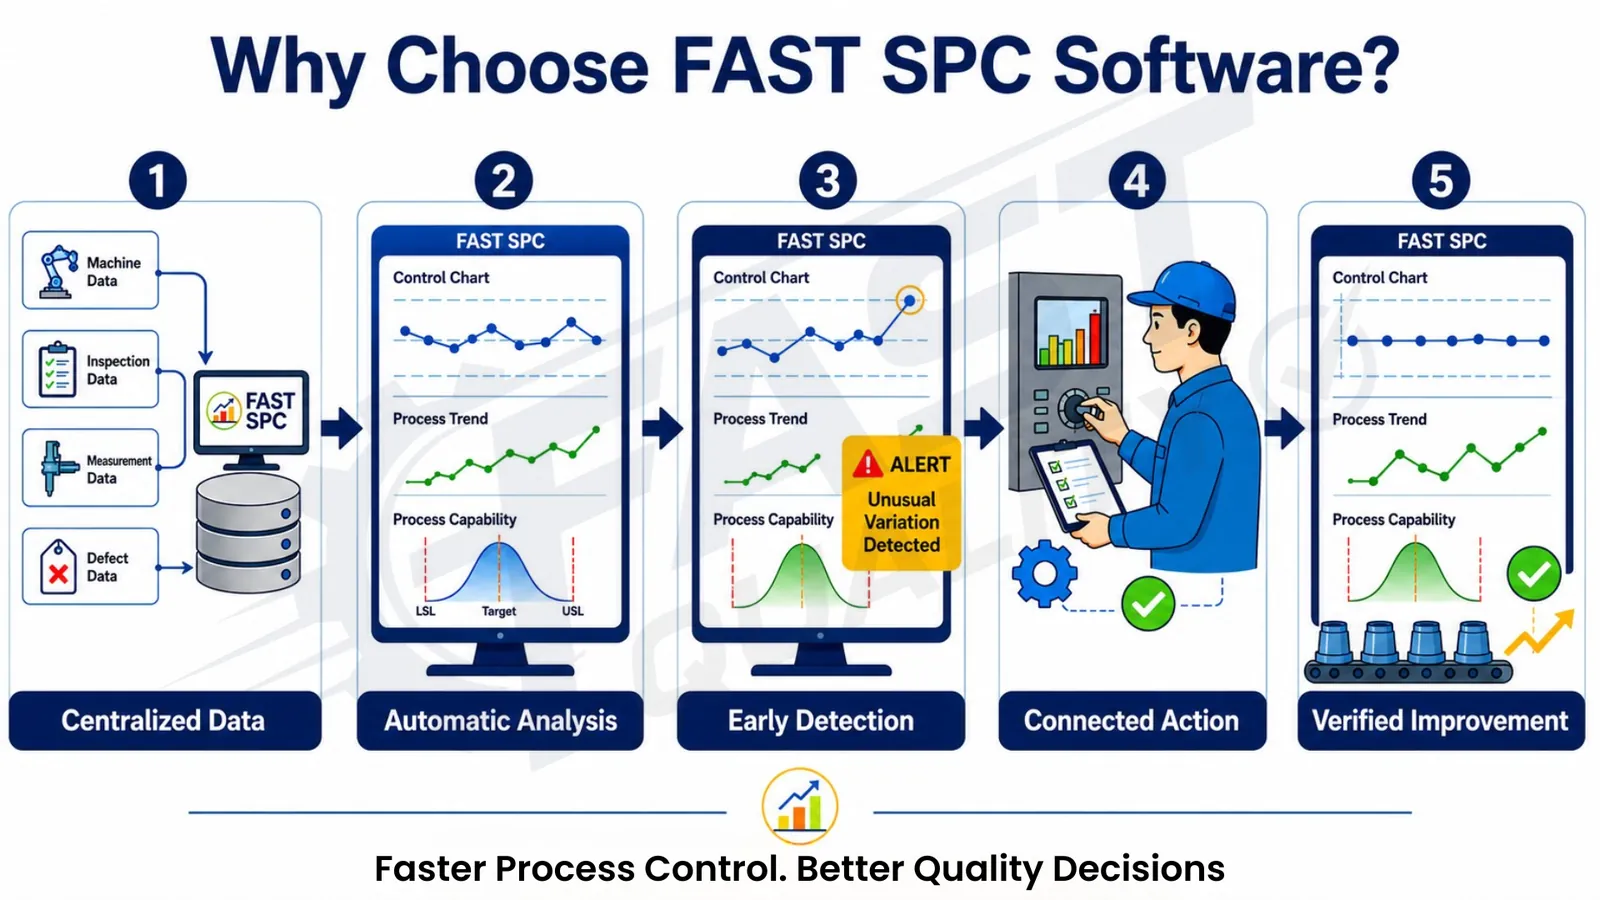
FAST SPC Software converts measurements, defect data and inspection results into statistical insight. Teams can detect variation, investigate causes and verify whether the process has returned to a stable condition.
FAST SPC Software supports charts for measured process data and defect-based data. Selecting the right chart depends on whether the data is continuous or counted, and whether the sample size is constant or changing.
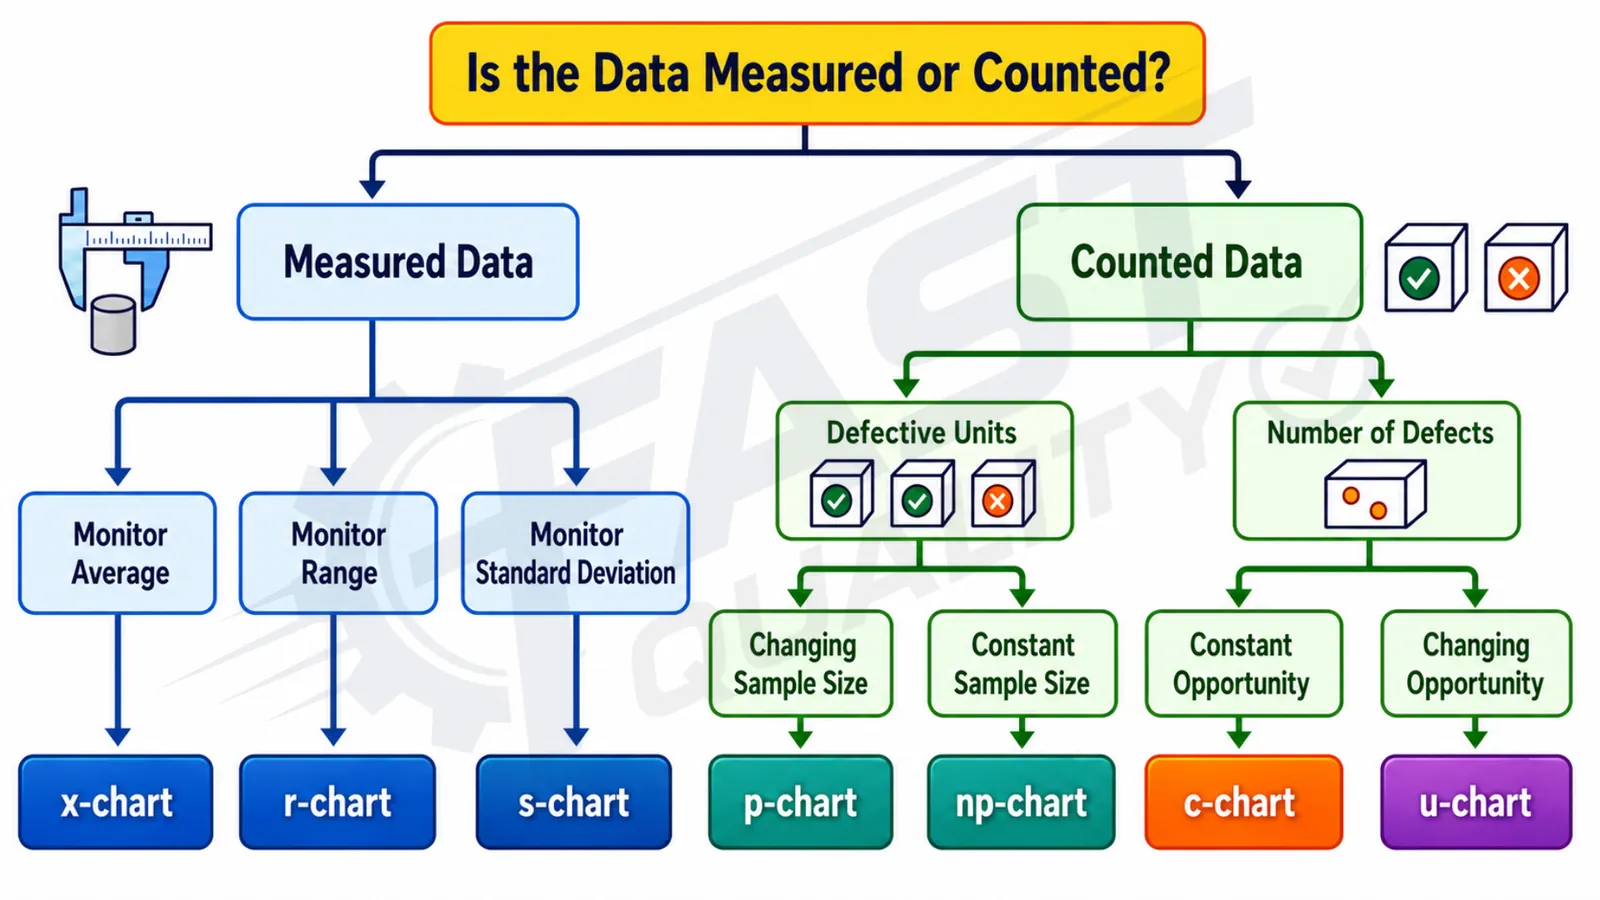
Monitors the process average for measured subgroup data.
Monitors subgroup variation using the range.
Monitors subgroup variation using standard deviation.
Monitors the proportion of defective units when sample size may vary.
Monitors the number of defective units when sample size is constant.
Monitors the number of defects in a constant inspection unit.
Monitors defects per unit when opportunity or sample size changes.
Match the chart to the data structure to avoid misleading conclusions.
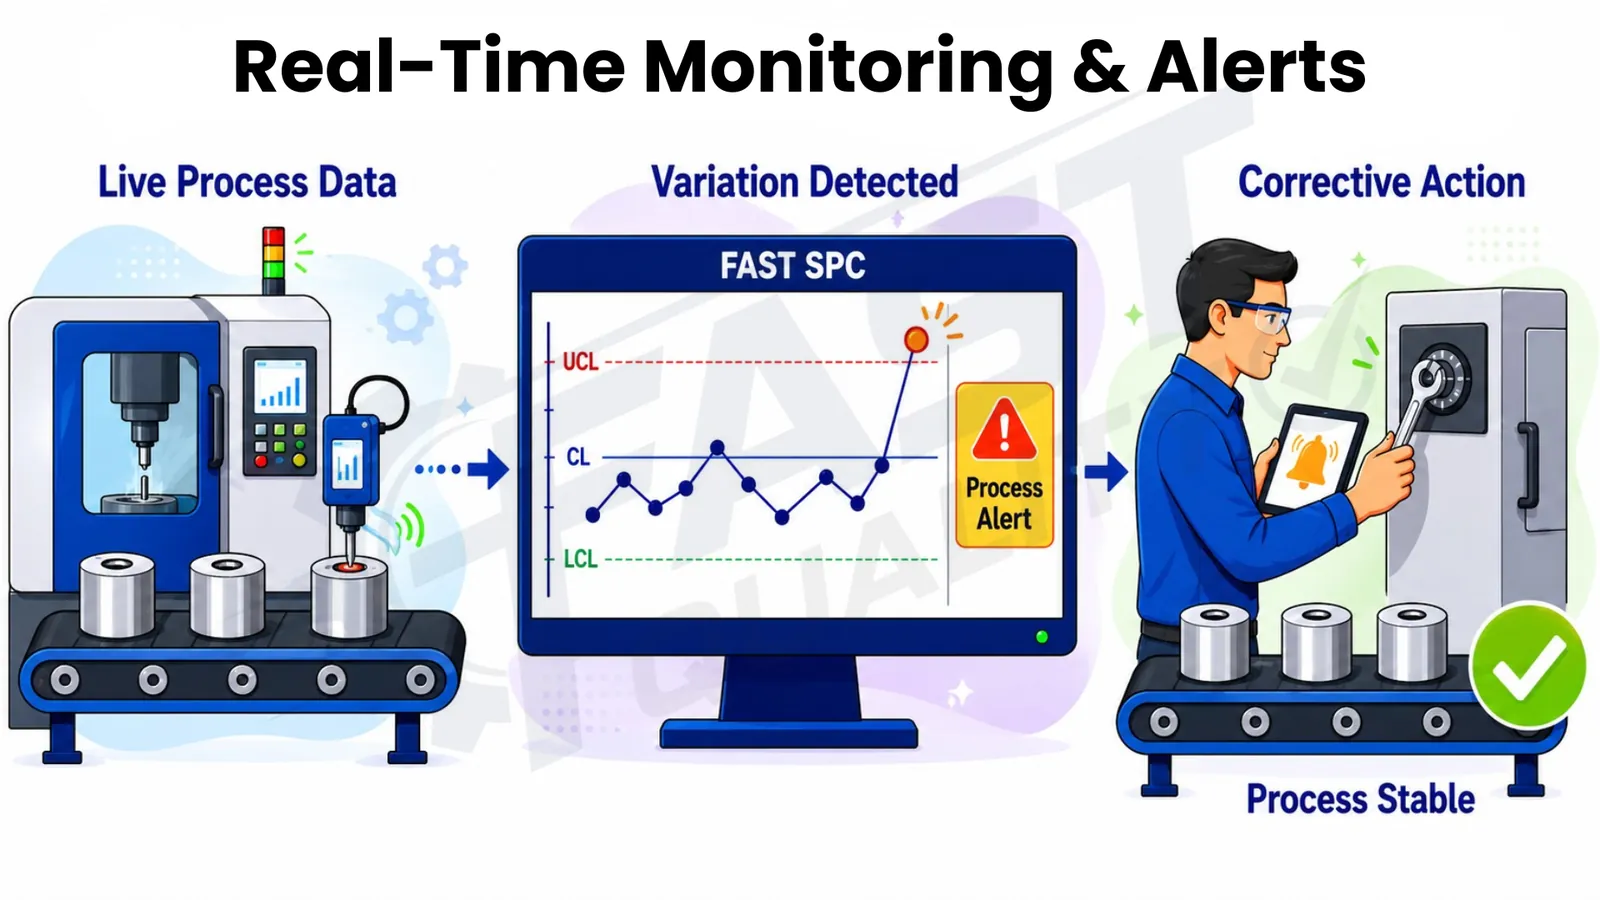
FAST SPC Software continuously monitors incoming data so teams can identify unusual variation before it develops into widespread defects, rework or production disruption.
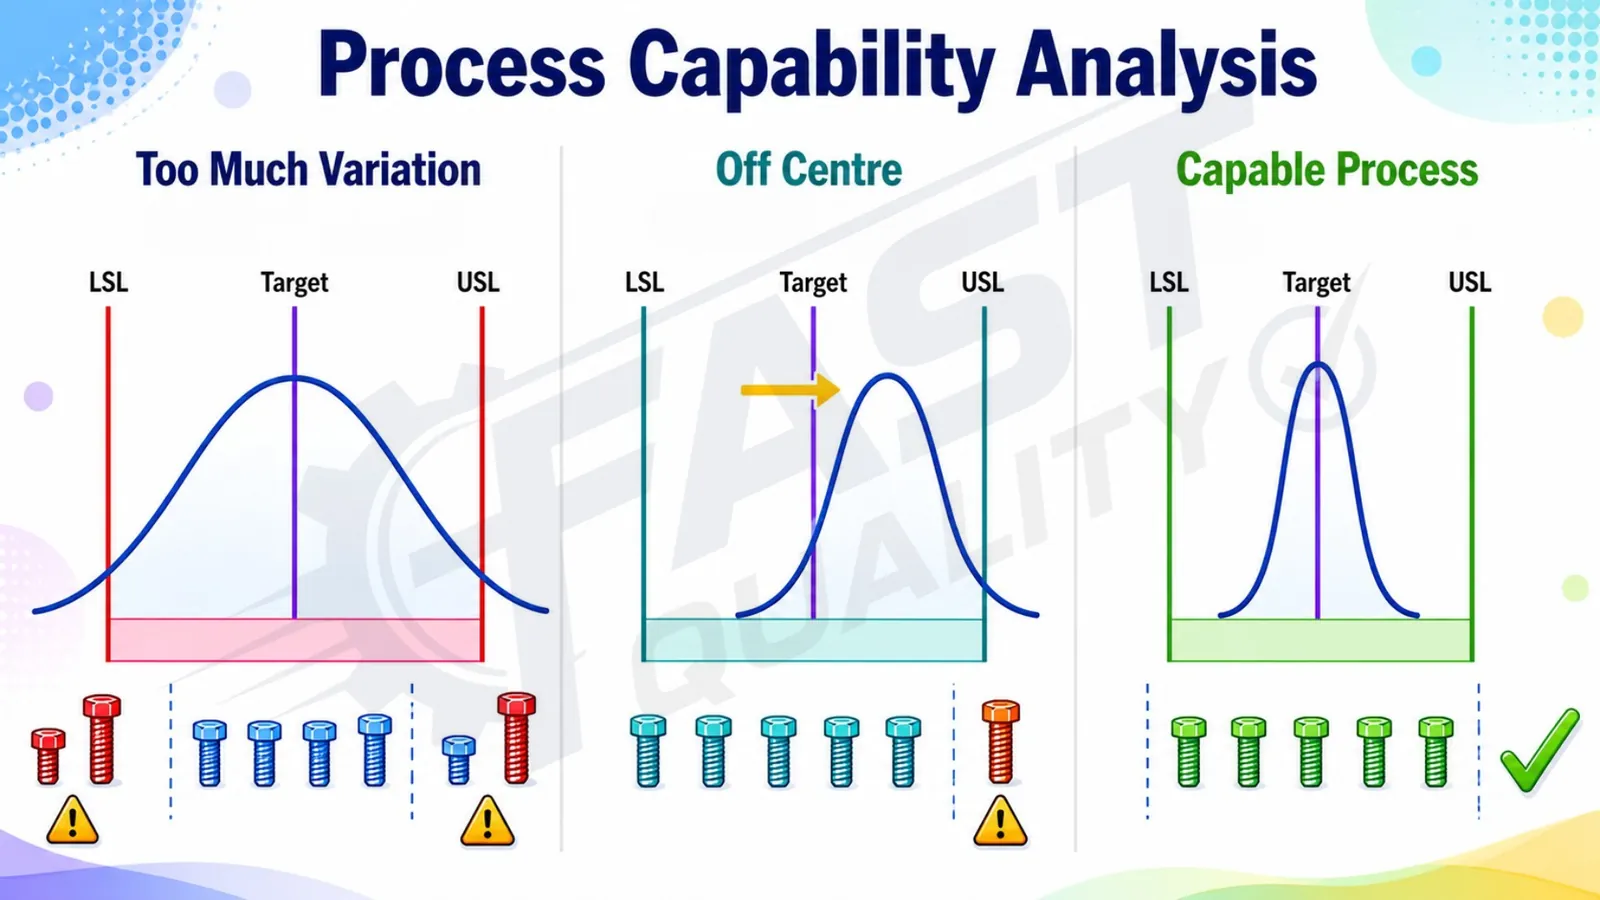
Process capability analysis helps teams understand how well a stable process can produce output within required specification limits. FAST SPC supports capability review with Cp, Cpk, process spread and centring insights.
Shows potential capability by comparing process spread with specification width.
Shows actual capability by considering both process spread and centring.
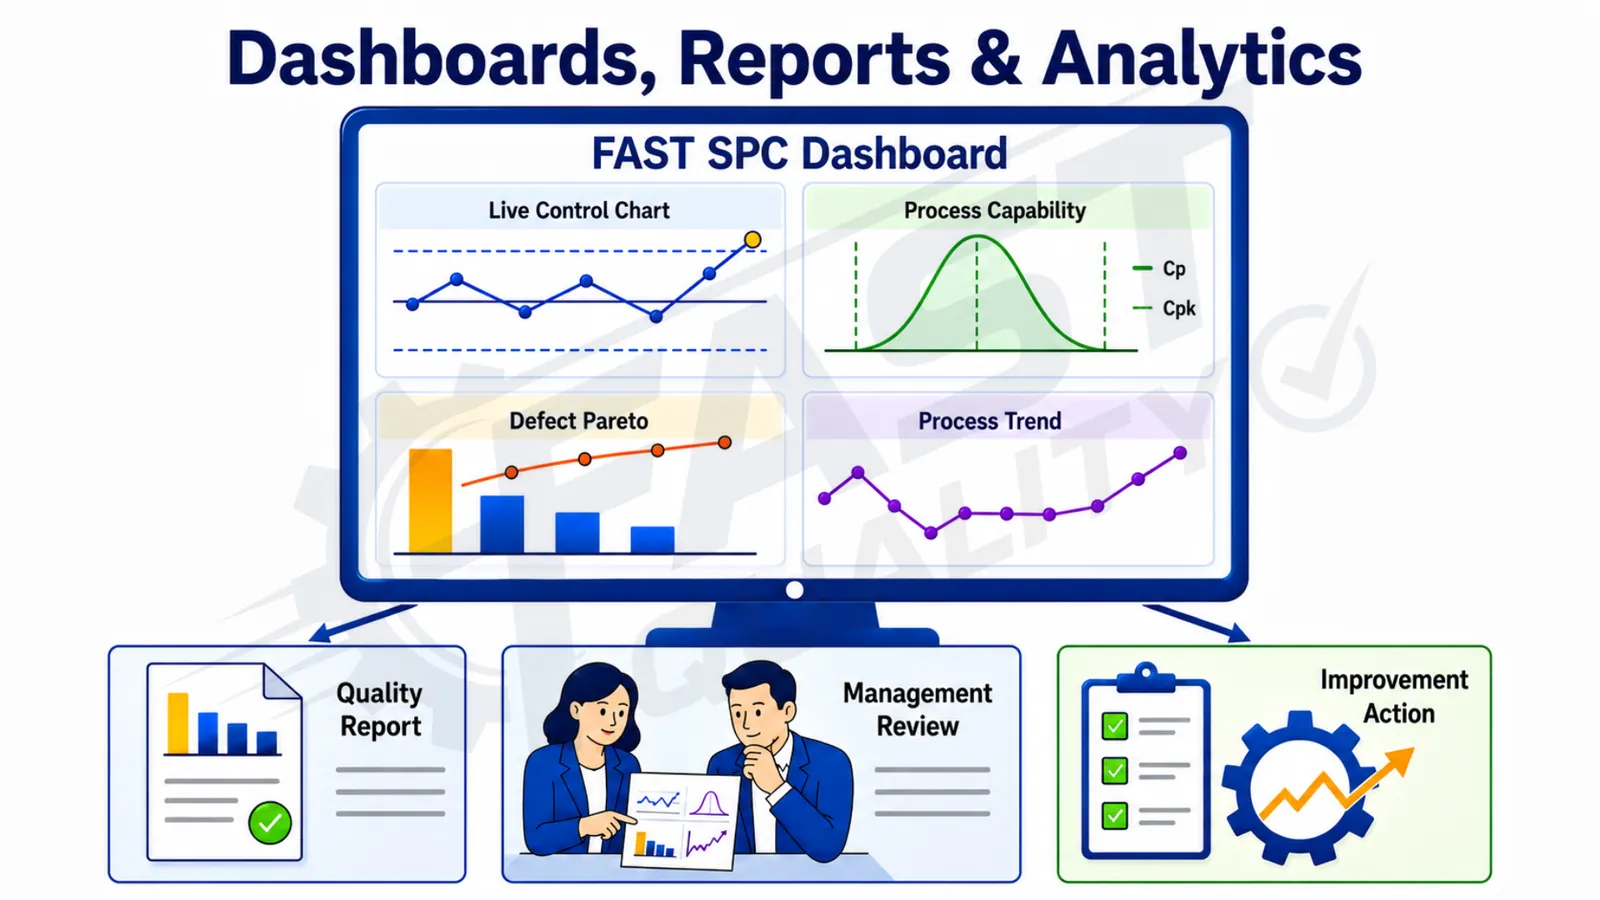
FAST SPC dashboards and reports help teams move from individual chart readings to process-level visibility, management review and data-based improvement decisions.
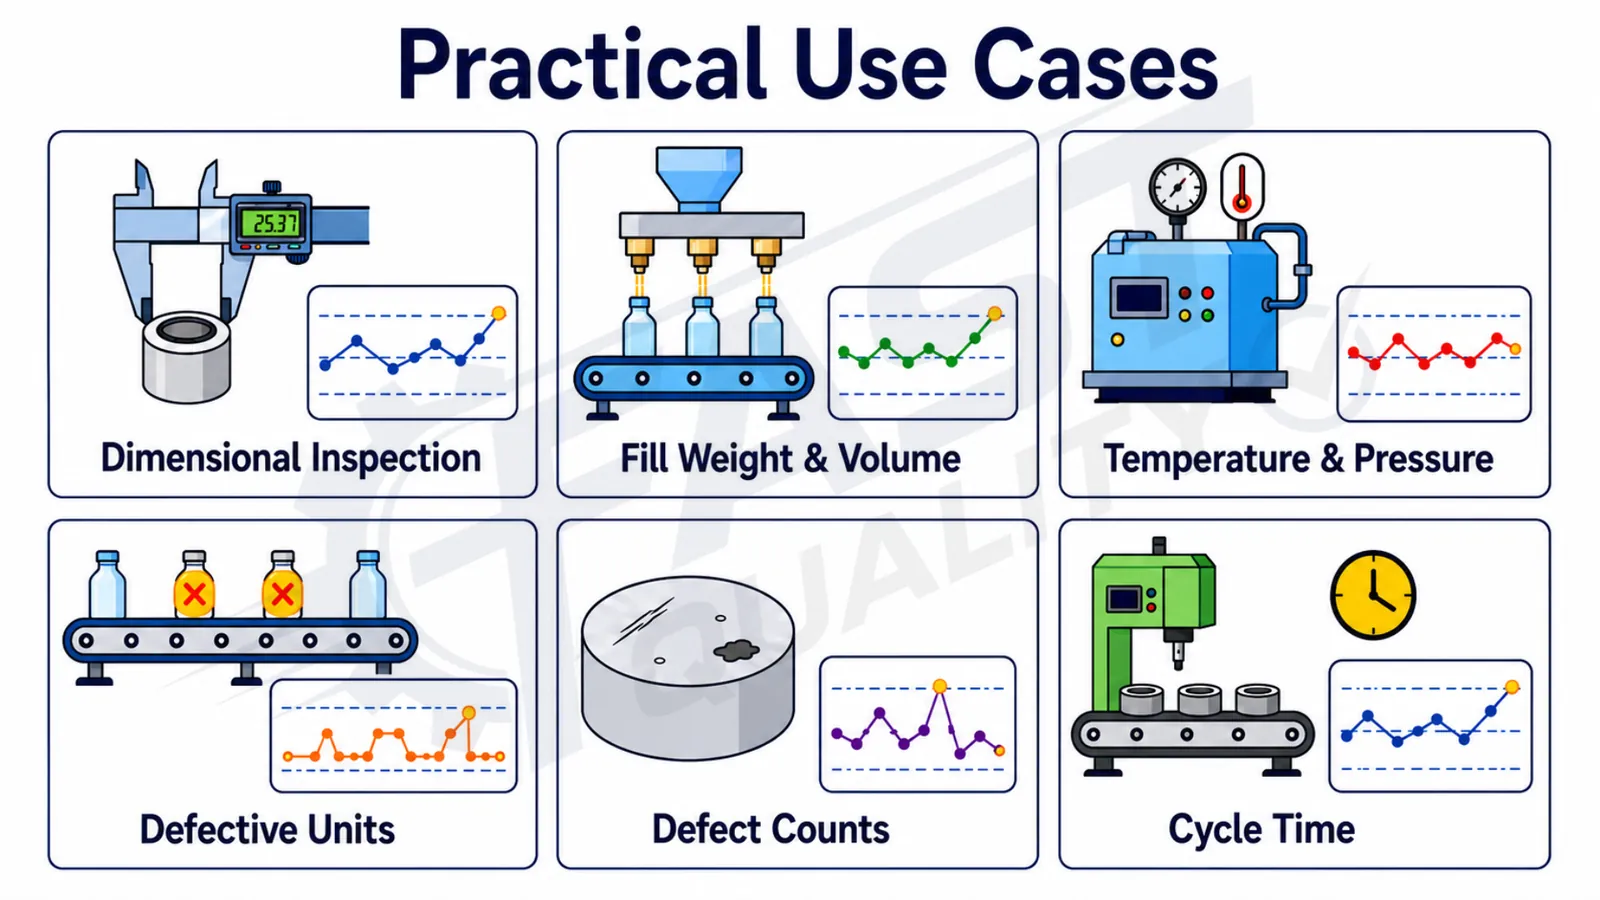
FAST SPC Software can be used wherever measurable values, defective units or defect counts are collected over time. It supports production, inspection, supplier quality, laboratory and process-improvement work.
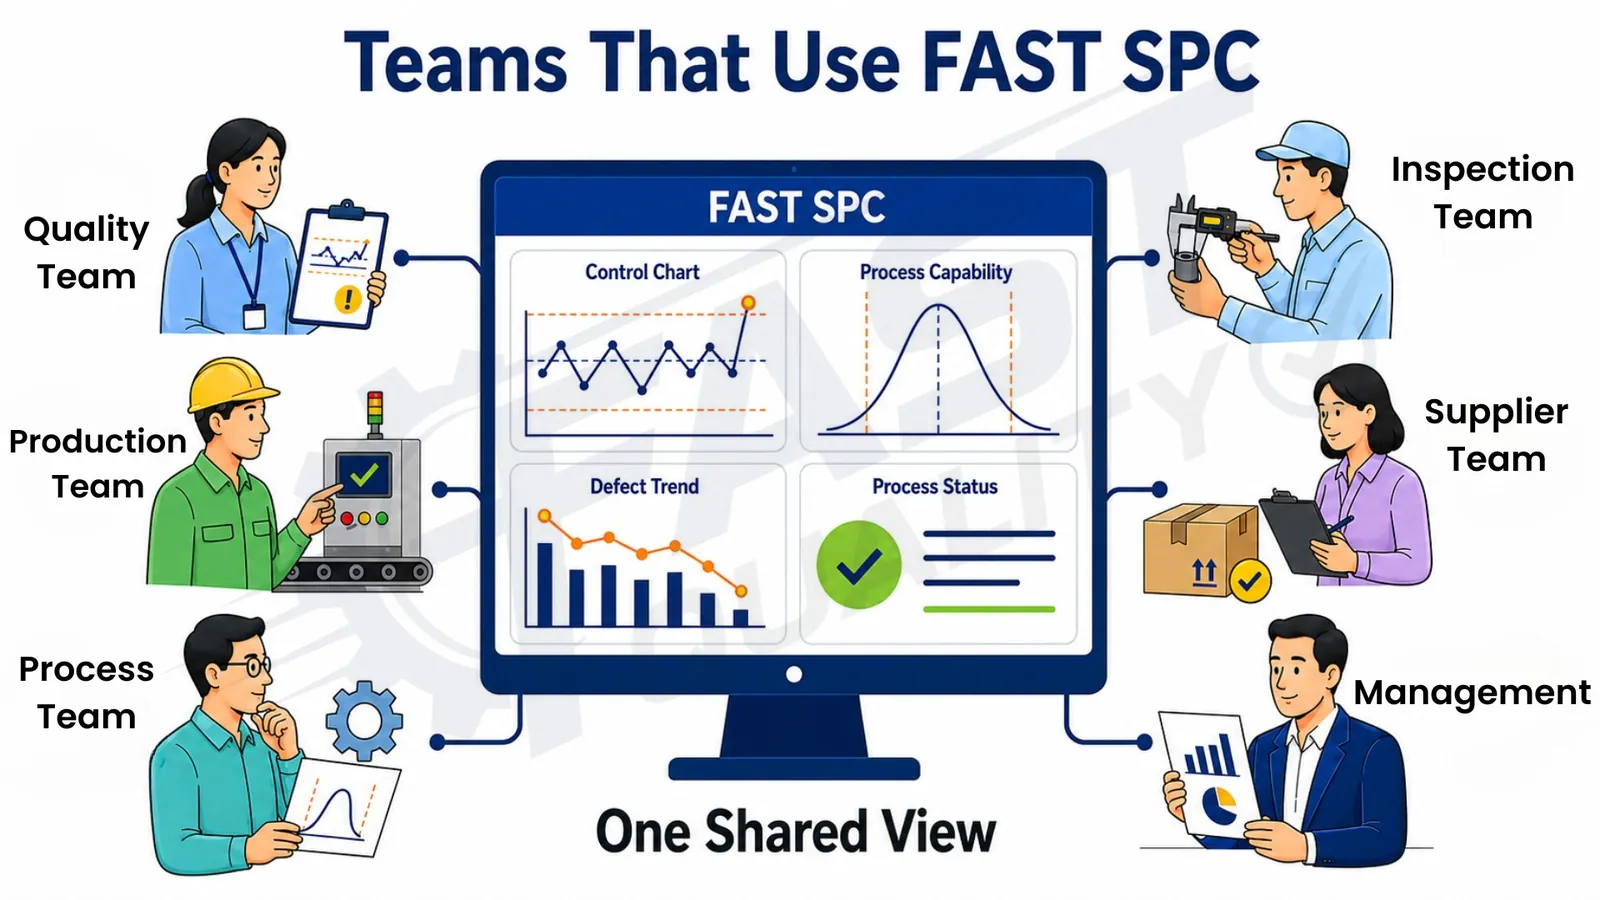
FAST SPC Software gives cross-functional teams one shared statistical view of process performance while letting each team focus on the information most relevant to its role.
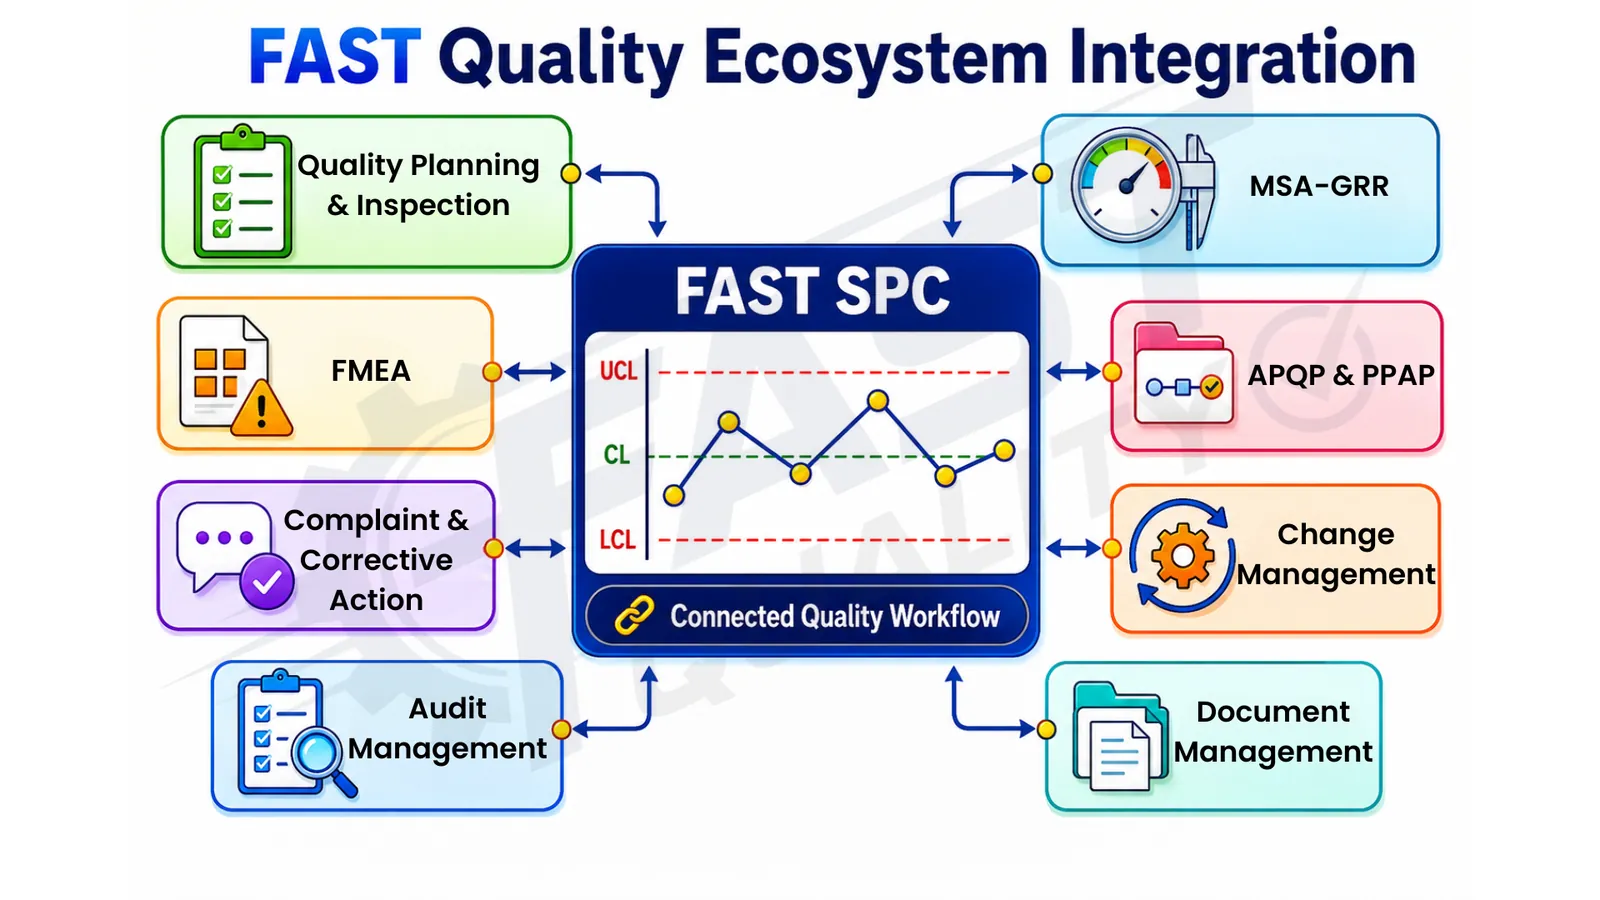
FAST SPC Software can work as part of the wider FAST Quality ecosystem rather than remaining an isolated statistical tool. Process signals, capability results and investigations can connect with related quality activities across the organization.
Manual SPC depends on paper forms, spreadsheets, separate calculations and periodic review. FAST SPC brings data collection, charting, alerts, capability analysis, reporting and follow-up into one controlled system.
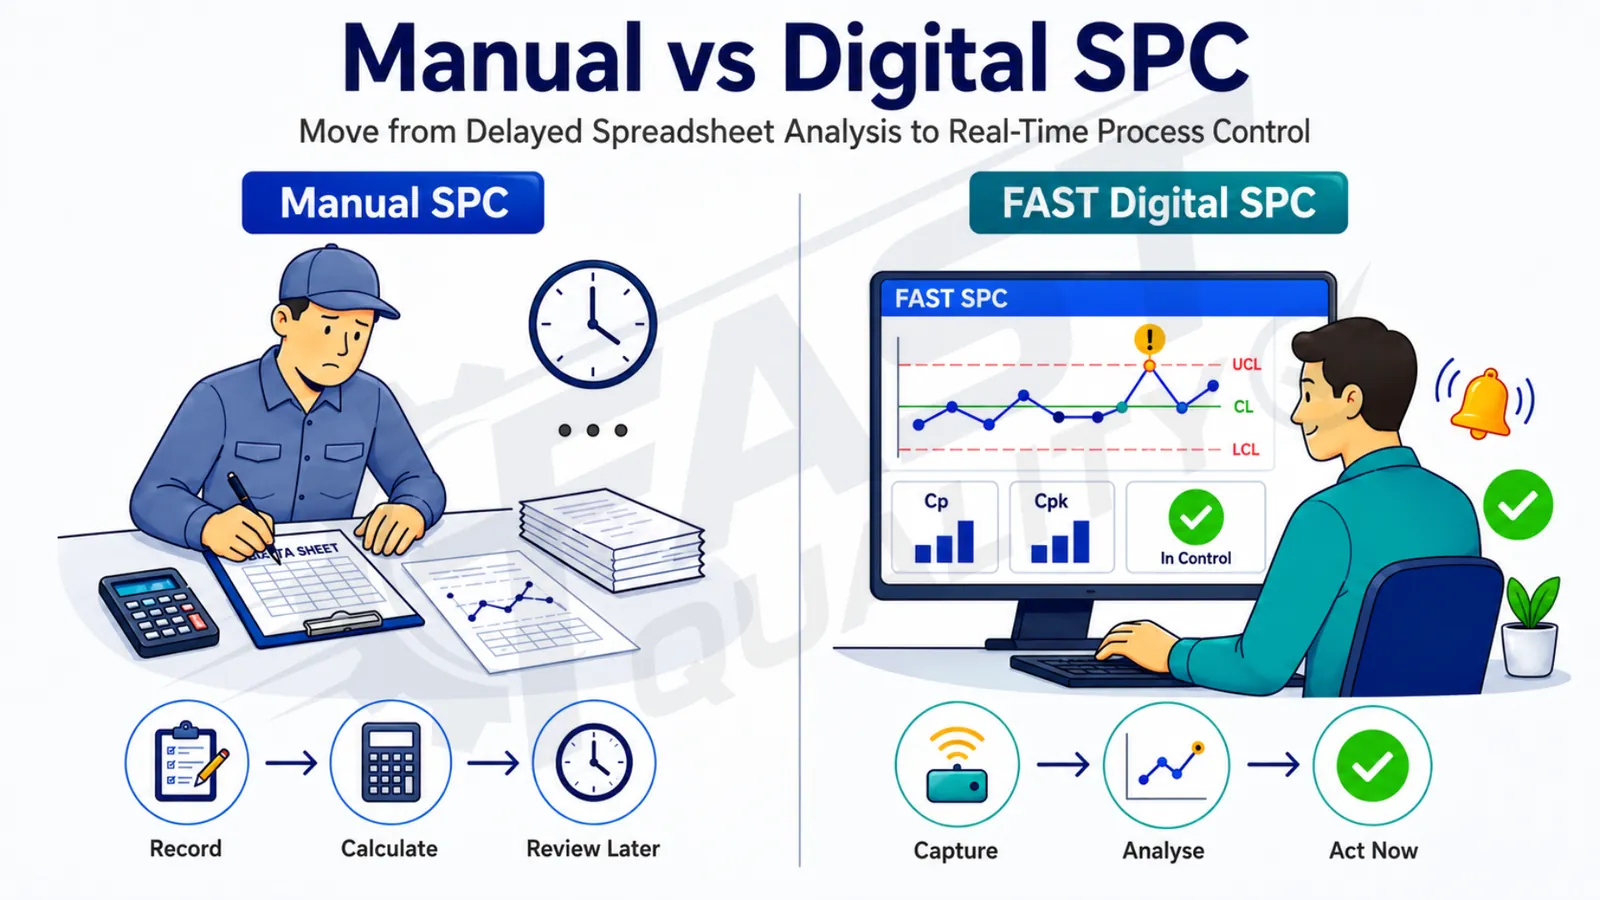
| Area | Manual SPC | FAST Digital SPC |
|---|---|---|
| Chart creation | Prepared manually | Generated automatically |
| Calculations | Spreadsheet formulas | Automated statistical calculations |
| Signal detection | Depends on manual review | Automatic signal identification |
| Alerts | Calls, messages or emails | Structured process alerts |
| Traceability | Difficult to maintain | Complete historical record |
FAST SPC Software helps quality and production teams move beyond manual chart preparation and delayed analysis. It combines process monitoring, control charts, capability analysis, alerts, reports and connected quality workflows in one centralized system.
Short answers for teams comparing SPC tools, spreadsheet SPC and connected quality software.
Use FAST SPC Software to monitor variation, detect process signals, analyse capability and connect improvement actions across your quality system.